Introduction

Memory Analyzer Screenshot (Thumbnail)

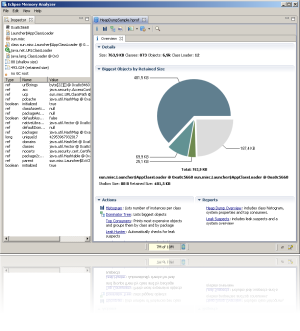
The Eclipse Memory Analyzer is a fast and feature-rich Java heap analyzer that helps you find memory leaks and reduce memory consumption.

Use the Memory Analyzer to analyze productive heap dumps with hundreds of millions of objects, quickly calculate the retained sizes of objects, see who is preventing the Garbage Collector from collecting objects, run a report to automatically extract leak suspects.

Getting Started

Basic Tutorial

Concepts

Heap Dump

Reachability

Shallow vs. Retained Heap

Dominator Tree

Garbage Collection Roots

Tasks

Acquiring Heap Dumps

Installing IBM DTFJ feature for IBM dumps

Running Leak Suspect Report

List the Biggest Objects

Finding Responsible Objects

Querying Heap Objects (OQL)

Analyze Class Loader

Analyzing Threads

Analyzing Java Collection Usage

Analyzing Finalizer

Eclipse Equinox Bundle Registry

Comparing Objects

Export Data

Export Heap Dump

Batch mode

Problems displaying reports

Memory Analyzer Configuration