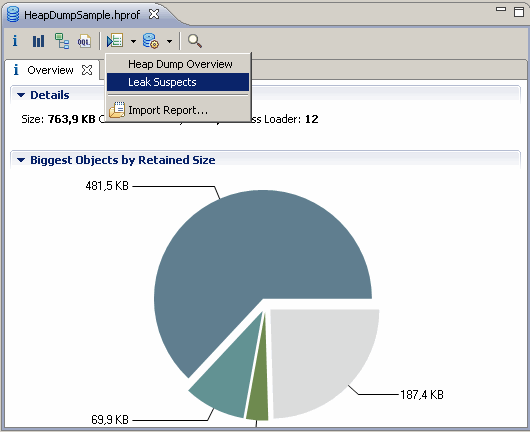
As a result an HTML report will be opened. It contains an overview of the heap dump and leak suspect info.
This report will be stored together with the heap dump and can be displayed when you open the heap dump again.
Some of the sections in the leak suspects report have links to rerun the individual queries which make up the report. This can be useful for further analysis. See Pie Chart Links for links from pie charts.
The standard leak suspects report operates just using the heap dump data, which is a snapshot from a particular moment. It does not use any time information as to when objects were allocated.
The starting point is the dominator tree . The biggest items at the top level of the dominator tree are analyzed, and if an item retains a significant amount of memory (default is 10%) then that item could be the cause of the memory leak because if it were no longer referenced then all that memory could be freed.
It could be that single objects do not retain a significant amount of memory but many objects all of one type do. This is a second class of leak suspect. This type is found using the dominator tree, grouped by class.
Further analysis is then done on each leak suspect. For a single object leak suspect the retained objects are analyzed in the dominator tree to see if there is an accumulation point . An accumulation point is an object with a big difference between the retained size of itself and the largest retained size of a child object. These are places where the memory of many small objects is accumulated under one object.
If the leak suspect is a thread then thread related information such as the call stack is shown, together with interesting stack frames which have local variables referring to objects on the path to the accumulation point. If the leak suspect is a class loader then this is mentioned as being an interesting component of the application. If the leak suspect is a class then its class loader is mentioned as being an interesting component of the application.
The Shortest Paths To the Accumulation Point shows a path from a garbage collection root to the accumulation point. There will be other paths, otherwise an object on the path would retain the leak suspect, so itself would be considered a leak suspect. If the root is a thread object then thread related information is also shown.
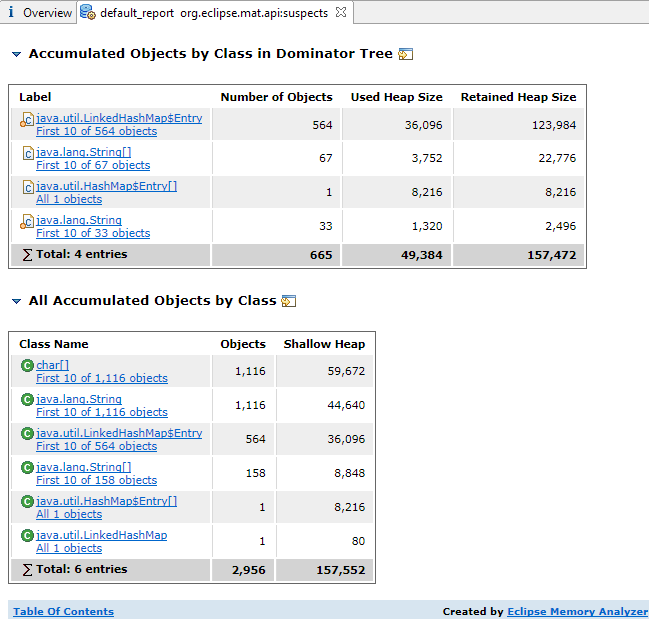
The Accumulated Objects in Dominator Tree shows the dominator tree from the leak suspect to the accumulation point and also the objects that the accumulation point retains. This helps understand the context of the leak, and what is being accumulated. The Accumulated Objects by Class in Dominator Tree shows just the children in the dominator tree of the accumulation point, grouped by class. This is useful if there are many objects, as there will be fewer types than objects. All Accumulated Objects by Class shows all the objects retained by the accumulation point, including the accumulation point, but grouped by class so it easier to see what is taking up the heap space.
If the leak suspect is a group of objects then these objects are all of the same type (class) which are at the top level of the dominator tree. Each individual object is not retained by a single other object. The query attempts to find an object which indirectly refers to all of those objects. This is also called an accumulation point but is below the leak suspects in the dominator tree, rather than above the leak suspect object in the single object case. The accumulation point is a single object through which there is a path from the GC roots to most of the objects. There will be other paths to the suspect objects, otherwise the accumulation point would be a leak suspect in its own right. The accumulation point is useful in understanding the leak as it shows one reason that the suspect objects are reachable and so alive. The standard options for the query ignore weak, soft, phantom and finalizer references when finding paths. In the report, the text Most of these instances are referenced from one instance of introduces the accumulation point.
The query also attempts to find an interesting
(not a standard Java class
java. javax. com.sun. jdk.) Java object which directly or indirectly refers
to the accumulation point. This means that if the accumulation
point is a array or object inside a standard Java collection then
the interesting object might be part of the application itself.
The text in the report The instance is referenced by introduces this interesting object.
If the shortest path from the GC roots to accumulation point starts with a thread, then thread related information such as the call stack is shown, together with interesting stack frames which have local variables referring to objects on the path to the accumulation point.
If the leak suspect is a group of objects then the biggest few objects are shown by Biggest Instances (Overview) which is a pie chart and Biggest Instances which is a histogram. If there are many objects and none uses more than 1% of the leak then these is omitted.
Suspect Objects by Class This is a histogram showing the suspect objects. They will all be of the same type. This section makes it easy to continue analysis of the leak by click on the link to view the suspects interactively.
All Objects by Class Retained by Suspect Objects This shows all the objects retained by the suspect and helps explain why all the memory is being used. Perhaps instead of removing the leak the problem can be reduced by changing the application code to have fewer or smaller objects referenced from the suspects.
Common Path To the Accumulation Point shows a shortest path from a GC root to the accumulation point, giving a guide as to what in the application refers to the accumulation point. By default this path ignores weak, soft, phantom and finalizer references when finding paths. If the root of this path is a thread then some interesting thread related information is also extracted.
Accumulated Objects in Dominator Tree Accumulated Objects by Class in Dominator Tree These show the accumulation point in the dominator tree, showing how it is retained, and the objects it retains.
All Accumulated Objects by Class This shows the objects retained by the accumulation point.
Reference Pattern If the leak suspect is a group of objects but there is not an accumulation point then the reference pattern shows the merged shortest paths to GC roots.
Keywords The keyword section has words which could be useful to match this problem to previous problem instances.
Learn more in this blog posting: Automated Heap Dump Analysis: Finding Memory Leaks with One Click .
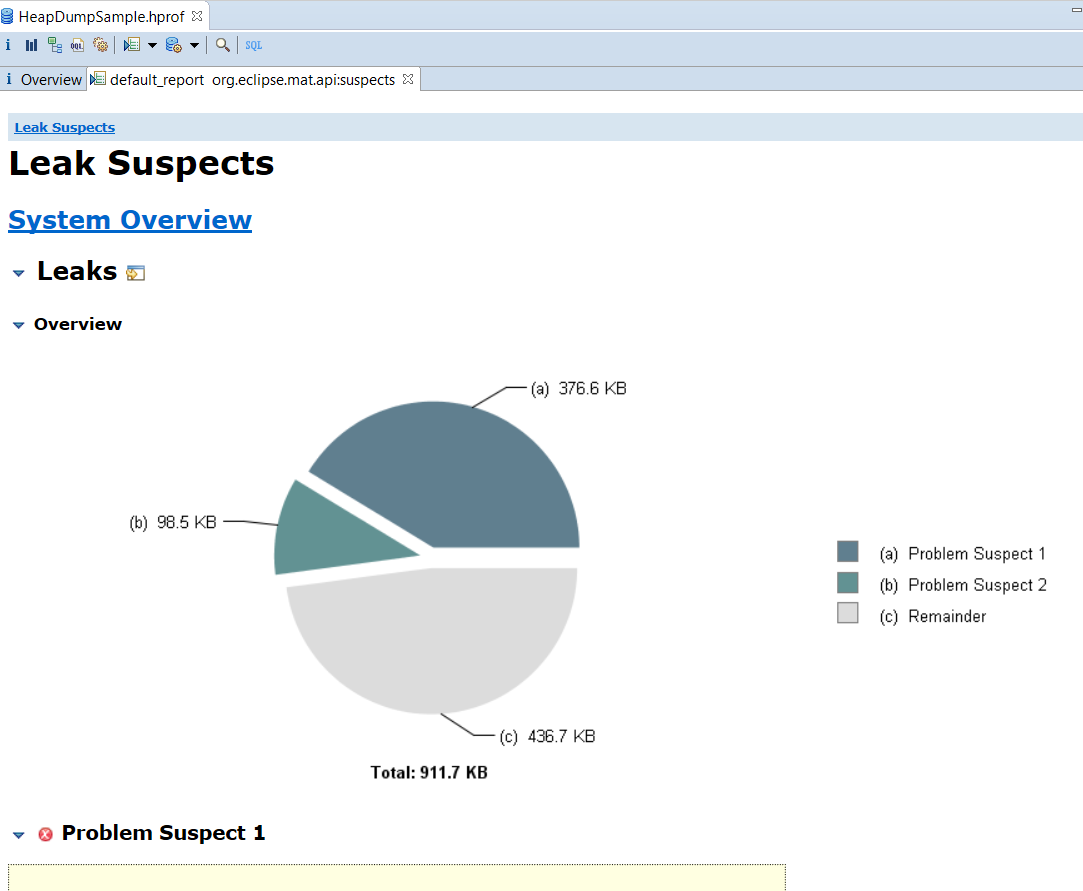
Examples of summaries of leak suspects:
Problem Suspect 1
One instance of "org.eclipse.mat.ui.compare.CompareBasketView$ComparePolicy"
loaded by "org.eclipse.mat.ui" occupies 487,234,584 (28.60%) bytes.
The memory is accumulated in one instance of "java.lang.Object[]",
loaded by "<system class loader>", which occupies 487,234,328 (28.60%) bytes.
Keywords
org.eclipse.mat.ui.compare.CompareBasketView$ComparePolicy
org.eclipse.mat.ui
java.lang.Object[]
Problem Suspect 2
The thread java.lang.Thread @ 0xe0c2ac98 main keeps local variables with total size 5,394,048 (68.41%) bytes.
The memory is accumulated in one instance of "org.eclipse.mat.tests.CreateCollectionDump", loaded by "jdk.internal.loader.ClassLoaders$AppClassLoader @ 0xe0c137a0", which occupies 5,393,416 (68.40%) bytes.
The stacktrace of this Thread is available. See stacktrace. See stacktrace with involved local variables.
Keywords
org.eclipse.mat.tests.CreateCollectionDump
jdk.internal.loader.ClassLoaders$AppClassLoader @ 0xe0c137a0
org.eclipse.mat.tests.CreateCollectionDump.main([Ljava/lang/String;)V
CreateCollectionDump.java:174
Problem Suspect 3
The classloader/component "com.ibm.dtfj.j9" occupies 551,743,560 (55.09%) bytes.
The memory is accumulated in one instance of "com.ibm.j9ddr.corereaders.minidump.WindowsProcessAddressSpace",
loaded by "com.ibm.dtfj.j9", which occupies 540,840,744 (54.00%) bytes.
Keywords
com.ibm.dtfj.j9
com.ibm.j9ddr.corereaders.minidump.WindowsProcessAddressSpace
Problem Suspect 4
The class "java.lang.ref.Finalizer", loaded by "<system class loader>",
occupies 188,628,792 (18.83%) bytes.
The memory is accumulated in one instance of "com.ibm.dtfj.java.j9.JavaRuntime",
loaded by "com.ibm.dtfj.j9", which occupies 186,736,528 (18.64%) bytes.
Keywords
java.lang.ref.Finalizer
com.ibm.dtfj.java.j9.JavaRuntime
com.ibm.dtfj.j9
Problem Suspect 5
19,414,929 instances of "int[]",
loaded by "<system class loader>" occupy 716,412,176 (42.05%) bytes.
These instances are referenced from one instance of "java.lang.Object[]",
loaded by "<system class loader>", which occupies 77,659,616 (4.56%) bytes.
Keywords
int[]
java.lang.Object[]
Problem Suspect 6
2 instances of "org.eclipse.mat.parser.internal.SnapshotImpl",
loaded by "org.eclipse.mat.parser" occupy 261,910,656 (15.37%) bytes.
Biggest instances:
org.eclipse.mat.parser.internal.SnapshotImpl @ 0x6ff5af620 - 136,622,272 (8.02%) bytes.
org.eclipse.mat.parser.internal.SnapshotImpl @ 0x6c2f6ce38 - 125,288,384 (7.35%) bytes.
These instances are referenced from one instance of "org.eclipse.swt.widgets.Display",
loaded by "org.eclipse.swt", which occupies 20,104 (0.00%) bytes.
Keywords
org.eclipse.mat.parser.internal.SnapshotImpl
org.eclipse.mat.parser
org.eclipse.swt.widgets.Display
org.eclipse.swt
Problem Suspect 7
1,868 instances of "java.lang.Class",
loaded by "<system class loader>" occupy 1,000,176 (12.68%) bytes.
Biggest instances:
class sun.util.calendar.ZoneInfoFile @ 0xffe065a0 - 151,368 (1.92%) bytes.
Keywords
java.lang.Class
Problem Suspect 8
One instance of "java.util.concurrent.ForkJoinTask[]" loaded by "<system class loader>" occupies 279.27 MB (40.12%) bytes. The instance is referenced by java.util.concurrent.ForkJoinWorkerThread @ 0xd53a1bf0 ForkJoinPool.commonPool-worker-0 , loaded by "<system class loader>".
The thread java.util.concurrent.ForkJoinWorkerThread @ 0xd53a1bf0 ForkJoinPool.commonPool-worker-0 keeps local variables with total size 120.71 KB (0.02%) bytes.
The memory is accumulated in one instance of "java.util.concurrent.ForkJoinTask[]", loaded by "<system class loader>", which occupies 279.27 MB (40.12%) bytes.
The stacktrace of this Thread is available. See stacktrace. See stacktrace with involved local variables.
Keywords
java.util.concurrent.ForkJoinTask[]
java.util.concurrent.ForkJoinPool$WorkQueue.execLocalTasks()V
ForkJoinPool.java:1040
Problem Suspect 9
1,417 instances of "org.eclipse.mat.hprof.SeekableStream$PosStream", loaded by "org.eclipse.mat.hprof" occupy 74,697,464 (31.80%) bytes.
Most of these instances are referenced from one instance of "java.util.TreeMap$Entry", loaded by "<system class loader>", which occupies 56,560 (0.02%) bytes. The instance is referenced by "org.eclipse.mat.hprof.SeekableStream @ 0x6053cd130", loaded by "org.eclipse.mat.hprof".
Keywords
org.eclipse.mat.hprof.SeekableStream$PosStream
org.eclipse.mat.hprof
java.util.TreeMap$Entry
org.eclipse.mat.hprof.SeekableStream
Problem Suspect 10
84,857 instances of "org.eclipse.swt.widgets.TreeItem", loaded by "org.eclipse.swt" occupy 30,539,432 (13.00%) bytes.
Most of these instances are referenced from one instance of "org.eclipse.swt.widgets.TreeItem[]", loaded by "org.eclipse.swt", which occupies 339,216 (0.14%) bytes.
Thread "java.lang.Thread @ 0x604802e10 main" has a local variable or reference to "org.eclipse.swt.widgets.Shell @ 0x604e4d848" which is on the shortest path to "org.eclipse.swt.widgets.TreeItem[84800] @ 0x61bc96500". The thread java.lang.Thread @ 0x604802e10 main keeps local variables with total size 41,544 (0.02%) bytes.
Significant stack frames and local variables
org.eclipse.mat.ui.internal.diagnostics.DiagnosticsWizardAction.run()V (DiagnosticsWizardAction.java:45)
org.eclipse.swt.widgets.Shell @ 0x604e4d848 retains 2,616 (0.00%) bytes
The stacktrace of this Thread is available. See stacktrace. See stacktrace with involved local variables.
Keywords
org.eclipse.swt.widgets.TreeItem
org.eclipse.swt
org.eclipse.swt.widgets.TreeItem[]
org.eclipse.mat.ui.internal.diagnostics.DiagnosticsWizardAction.run()V
DiagnosticsWizardAction.java:45