If you are using Memory Analyzer installed into Eclipse rather than a stand-alone Memory Analyzer, first open the 'Memory Analysis' perspective using: Window > Perspective > Open Perspective > Other ... > Memory Analysis
This tutorial provides a "jumping-off place" to get familiar with Memory Analyzer.
-
Get a Heap Dump
The Memory Analyzer works with heap dumps . Such a heap dump contains information about all Java objects alive at a given point in time. All current Java Virtual Machines can write heap dumps, but the exact steps depend on vendor, version and operation system. Find out more in the section Acquiring Heap Dumps .
-
Open
 a sample heap dump
if you view this page inside the Eclipse help center.
-
Start your application with Java 6
For the purpose of this tutorial, we use Java 6 and JConsole on Windows.
-
Start
<jre6>/bin/jconsole.exeand select the running application (in this case Eclipse):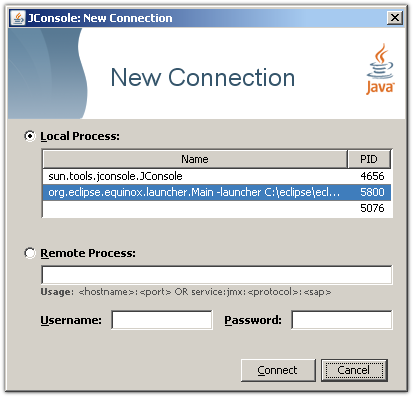
-
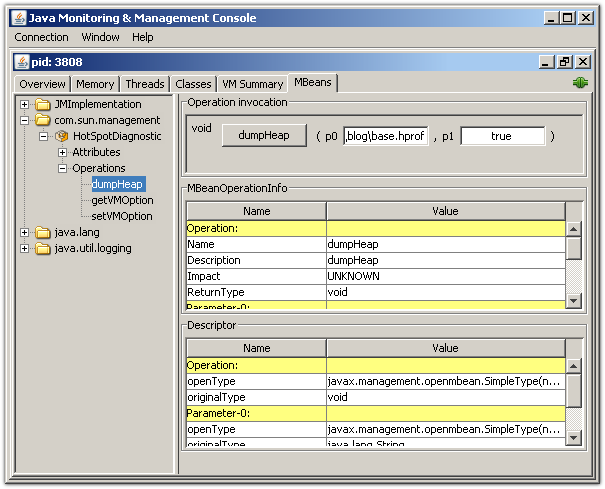
Select the operation
dumpHeap
from the
com.sun.management.HotSpotDiagnostic
MBean.
The first parameter p0 is the full path to the heap dump file. Make sure you give it the file extension .hprof. The second parameter p1 should be left at true as we are only interested in live objects.
-
Select the operation
triggerDumpToFile
from the
openj9.lang.management=OpenJ9Diagnostics
MBean.
- For OpenJ9/Semeru based JVMs (build openj9-0.18.0 and later), the parameters are:
- p0
- is the dump type and should be one of java, heap or system.
- p1
- is the full path to the dump file or directory. Make sure you give it the appropriate file extension .txt, .phd or .dmp.
Interface OpenJ9DiagnosticsMXBean
Note the name of the file. - For OpenJ9/Semeru based JVMs (build openj9-0.18.0 and later), the parameters are:
-
Acquire a heap dump directly using Eclipse Memory Analyzer
See Acquire Heap Dump from Memory Analyzer to acquire a heap dump from a locally running Java process directly using Eclipse Memory Analyzer. The actual Eclipse Memory Analyzer process could be used as a example Java process to generate a example heap dump.
-
Open
-
Examine the Overview
Open the heap dump via File >
 Open Heap Dump...
to see the overview page.
If you have a heap dump available, try
Open Heap Dump now.
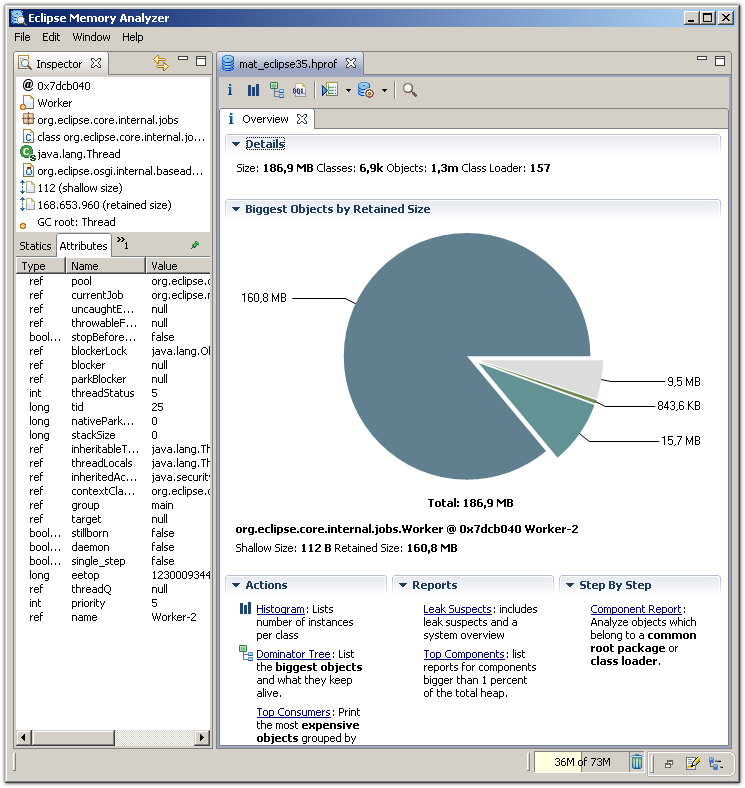
On the right, you'll find the size of the dump and the number of classes, objects and class loaders.
If the total size of the dump is much smaller than the size of the file it is possible that the heap dump contained many 'garbage' objects which would be discarded at the next garbage collection. See the unreachable objects query to examine these 'garbage' objects.
Right below, the pie chart gives an impression on the biggest objects in the dump. Move your mouse over a slice to see the details of the objects in the object inspector on the left. Click on any slice to drill down and follow for example the outgoing references.
-
Get the Histogram
Select the
 histogram
icon
from the tool bar to list the number of instances per class,
the
shallow size
and the
retained size
.
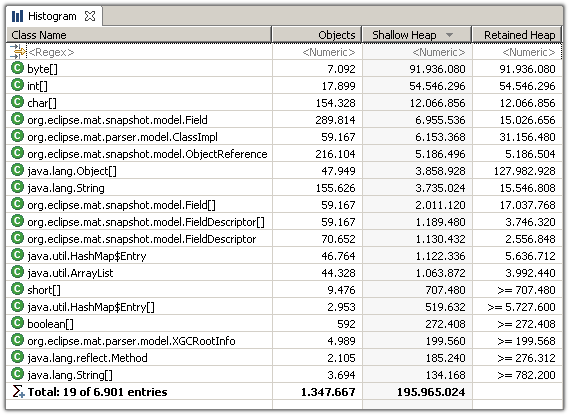
The Memory Analyzer displays by default the retained size of individual objects. However, the retained size of a set of objects - in this case all instances of a particular class - needs to be calculated.
To approximate the retained sizes for all rows, pick
 icon
from the tool bar. Alternatively, select a couple rows and use
the
context menu.

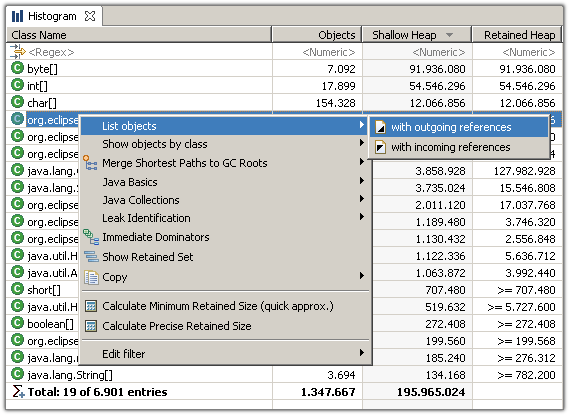
Using the context menu , you can drill-down into the set of objects which the selected row represents. For example, you can list the objects with outgoing or incoming references. Or group the objects by the value of an attribute. Or group the collections by their size. Or or or...
One thing that makes the Memory Analyzer so powerful is the fact that one can run any action on any set of objects. Just drill down and slice your objects the way you need them.
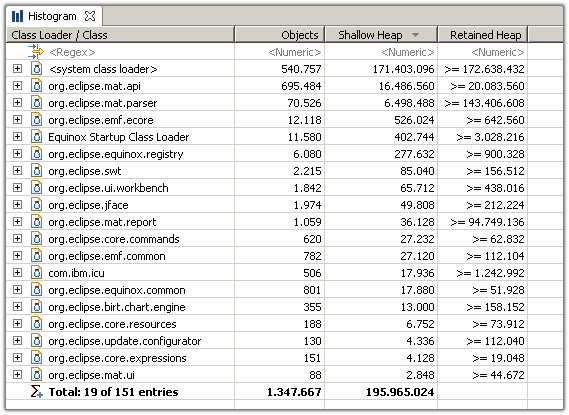
Another important feature is the facility to group any histogram by class loader, packages or superclass .

Any decent application loads different components by different class loaders. The Memory Analyzer attaches a meaningful label to the class loader - in the case of OSGi bundles it is the bundle id. Therefore it becomes a lot easier to divide the heap dump into smaller parts.
More: Analyze Class Loader
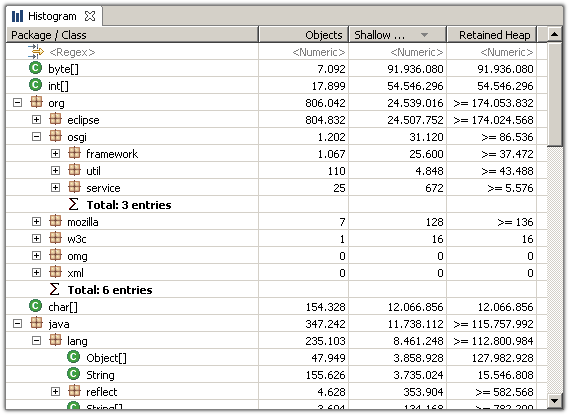
Grouping the histogram by packages allows to drill-down along the Java package hierarchy.
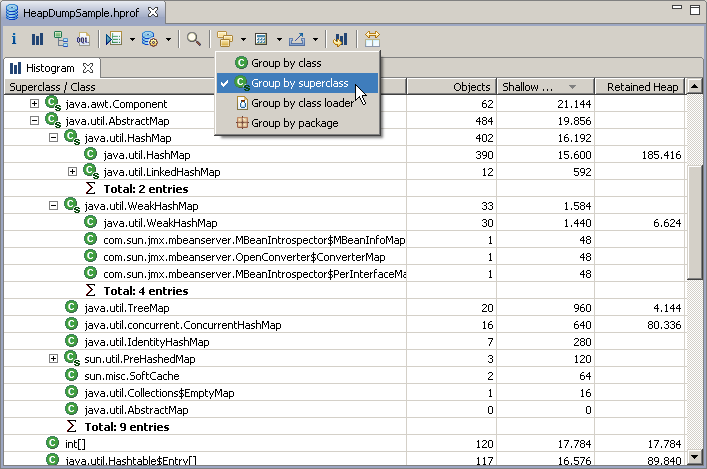
Grouping the histogram by superclass provides an easy way to find for example all the subclasses of java.util.AbstractMap, etc...
-
View the Dominator Tree
Select the
 dominator tree
icon
from the tool bar to display the dominator tree.
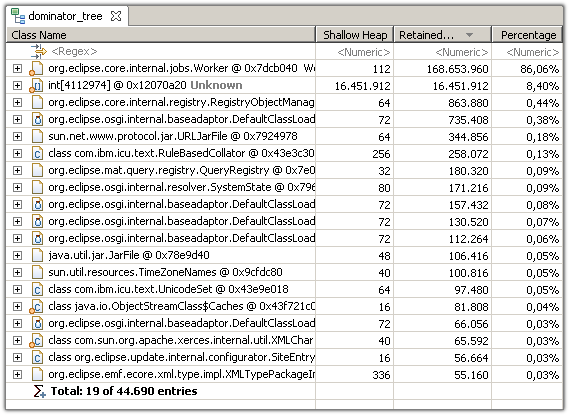
The
dominator tree
displays the biggest objects in the heap dump. The next level of
the
tree lists those objects that would be garbage collected if all
incoming references to the parent node were removed.
dominator tree
icon
from the tool bar to display the dominator tree.
The
dominator tree
displays the biggest objects in the heap dump. The next level of
the
tree lists those objects that would be garbage collected if all
incoming references to the parent node were removed.
The dominator tree is a powerful tool to investigate which objects keep which other objects alive. Again, the tree can be grouped by class loader (e.g. components) and packages to ease the analysis.
-
Path to GC Roots
Garbage Collections Roots (GC roots) are objects that are kept alive by the Virtual Machines itself. These include for example the thread objects of the threads currently running, objects currently on the call stack and classes loaded by the system class loader.
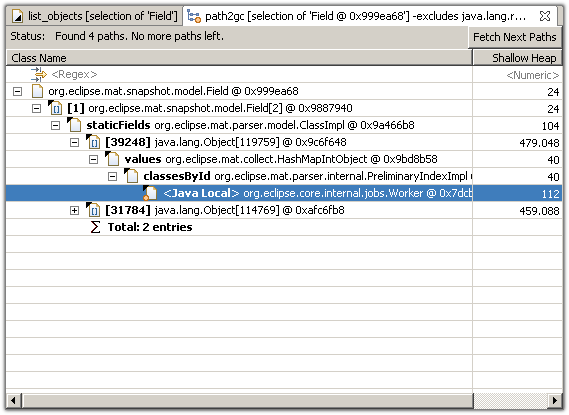
The (reverse) reference chain from an object to a GC root - the so called path to GC roots - explains why the object cannot be garbage collected. The path helps solving the classical memory leak in Java: those leaks exist because an object is still referenced even though the program logic will not access the object anymore.
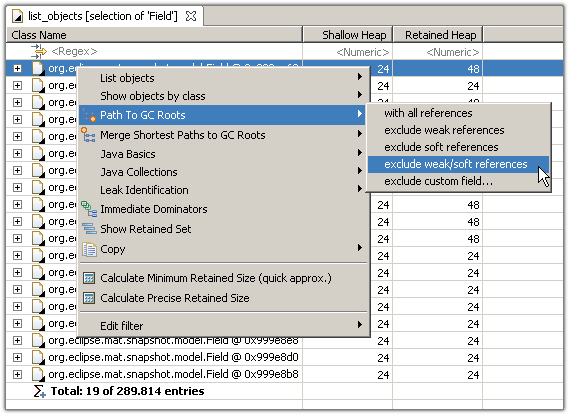
Initially, the GC root reached by the shortest path is selected.
-
Generate the Leak Report
The Memory Analyzer can inspect the heap dump for leak suspects, e.g. objects or set of objects which are suspiciously big.

Learn more in this blog posting: Automated Heap Dump Analysis: Finding Memory Leaks with One Click .
See running leak suspect report for information about the report.