Find out more about objects that could or should be garbage collected.
Motivation
Sometimes a heap dump contains objects which would be removed at the next garbage collection. These are objects which are unreachable from the garbage collection roots. By default, Memory Analyzer removes these objects as part of the parse process as normally they are not important in determining a memory leak. If the heap dump is generated as a result of an OutOfMemoryError then the Java virtual machine will usually have performed a garbage collection operation to attempt to free space for the new object, so there will not be those objects in the heap dump file. There is a chance that the garbage collection was not performed, for example if the object to be allocated was so huge that it was obvious to the JVM that no amount of garbage collection could free enough space, or if the heap dump was triggered by another event.
Sometimes however, it is interesting to investigate these unreachable objects. For example if the application is spending a lot of time garbage collecting then it may be allocating and discarding more objects than is sensible. The types of the objects which could be discarded at the next garbage collection gives a clue as to which temporary objects the application is causing to be allocated. When acquiring a heap dump for this purpose using the Memory Analyzer, do not use the live=true option as that would discard unreachable objects before the heap dump is generated.
Another reason for unreachable objects is if Memory Analyzer has been configured to discard objects on parsing to keep the number of remaining objects small enough for Memory Analyzer to handle. See Enable discard (experimental) for details.
Arguments
None
- From the link on the Overview page
- From the Query Browser via
Result
The result is a histogram table showing the class names and number of object instances of the unreachable objects, together with their total sizes. This histogram has no object graph behind it (unreachable objects are removed during the parsing of the heap dump, only class names are stored). Thus it is not possible to see e.g. a list of references for a particular unreachable object.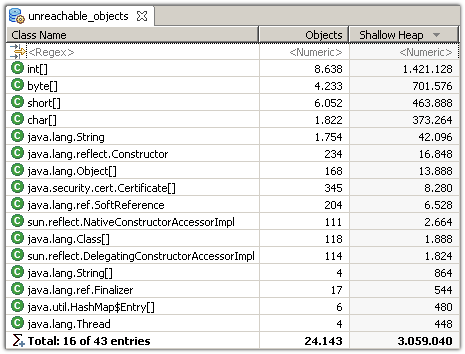
Continued analysis
If more information about the unreachable objects is required then the following steps can include the objects in the snapshot.
- Close the snapshot
- Select the heap dump using right-click,
- Select 'Keep unreachable objects' using
- Reopen the heap dump, which will reparse the heap dump.
- Select the query.
- Select the 'Unreachable Objects' row.
- Run the 'Show Retained Set' query on that row.