Well, analyzing big heap dumps can also require more heap space. Give it some more memory (possible by running on a 64-bit machine):
MemoryAnalyzer.exe -vmargs -Xmx4g
Alternatively, edit the MemoryAnalyzer.ini to contain:
-vmargs
-Xmx4g
For more details, check out the section Running Eclipse in the Help Center. It also contains more details if you are running on Mac OS X.
If you are running the Memory Analyzer inside your Eclipse SDK, you need to edit the eclipse.ini file.
The memory intensive parts are the parsing of the dump and building
of the dominator tree. Try parsing the heap
dump from the command line, perhaps on a bigger machine. The dumps
and index files can then be copied to a more convenient machine.
Once the dump has been parsed, it usually can
be opened with less memory in the GUI.
As a rough estimate if the number of objects is N and the number of
classes C, it might take at least T bytes to parse and build the dominator tree
where:
T ≈ N * 28.25 + C * 1000 + P
P is the space used by the DTFJ or HPROF parsers. For a PHD file, the space could be:
P ≈ C * 1000
Memory Analyzer uses additional memory for caching index files, so
performance will be better if there is more memory available than the minimum
required to parse a dump.
Memory Analyzer has an architectural limit of 231 - 3 objects, a current limit of 231 - 9 = 2,147,483,639 objects, but has not been tested with that many objects. The current record is a heap dump file of 159Gbytes containing 2,041,300,061 objects, which was opened with Memory Analyzer running with a 172Gbyte heap. Exceeding the limit can result in an exception such as java.lang.OutOfMemoryError: Requested length of new long[2,147,483,640] exceeds limit of 2,147,483,639. See enable discard for options to work around this limit.
The preference page is opened via a menu option.
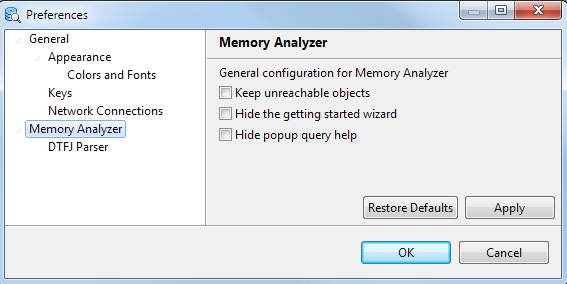
- Keep unreachable objects
- Objects that appear unreachable from GC roots are not discarded in an early stage of Memory Analyzer processing, but are retained for further analysis.
- Hide the getting started wizard
- Controls whether to display a wizard for leak suspects, top components after opening a snapshot.
- Hide popup query help
- Do not display the help panel underneath the query wizard, unless F1 or the help button is pressed.
- Hide the Welcome screen on launch
- The welcome page has the 'Overview' and 'Tutorials' tabs and the 'Workbench' button. The welcome page is closed by going to the workbench. Selecting this option means that when Memory Analyzer is started the workbench is displayed first. The welcome page can be reopened from the workbench by:
- Bytes Display
-
There is a option (from MAT 1.5 onwards) to display bytes in B, KB, MB, GB, or Smart formats. The default is to always display in Bytes format to match the previous MAT behavior and not cause any confusion. The option can be changed in the Eclipse preference dialog or using -Dbytes_display=(bytes|kilobytes|megabytes|gigabytes|smart).
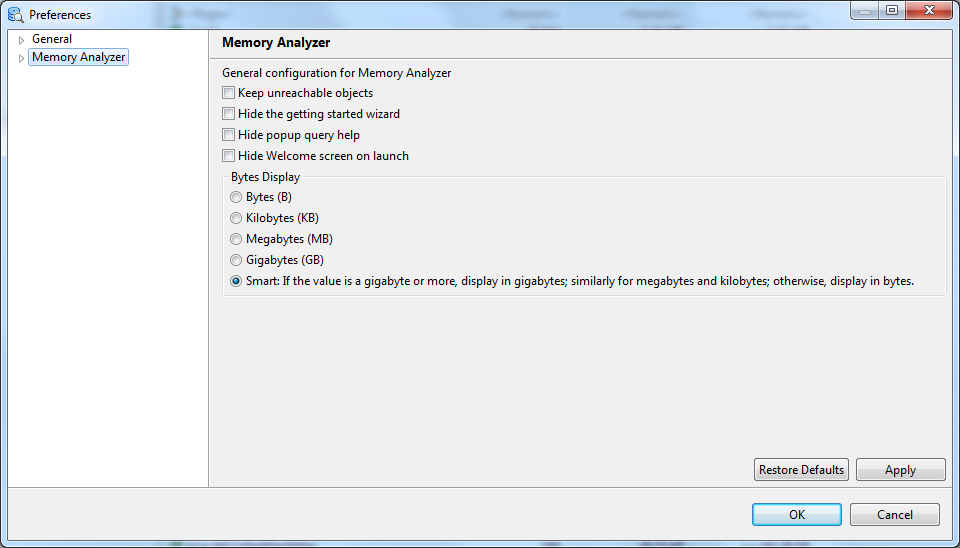
- Bytes (B)
- Memory counted in single bytes
- Kilobytes (KB)
- Memory counted in units of 1,024 bytes
- Megabytes (MB)
- Memory counted in units of 1,048,576 bytes
- Gigabytes (GB)
- Memory counted in units of 1,073,741,824 bytes
- Smart
- In Smart mode, if the value is a gigabyte or more, display in gigabytes; similarly for megabytes and kilobytes; otherwise, display in bytes.
- Expanded entries in tables and trees
- There can be many rows in the tables and trees produced by queries. This controls the number of new entries displayed after a double click on the totals row, or for the menu item or for expanding a tree entry or for the number of rows for a table or tree in a report, if not set by the limit.
- Enable discard (experimental)
-
Sometimes a heap dump is generated with more objects than Memory Analyzer can handle, either from lack of heap to run Memory Analyzer itself, or because the number exceeds the Memory Analyzer limit of 2,147,483,639 objects. This option controls some experimental settings to help analyze such huge dumps, by purposely discarding objects in the original heap dump.
The discarded objects are counted in the unreachable objects histogram together with any unreachable objects discarded by Memory Analyzer after parsing but before building the dominator tree.
The discarded objects are not indexed, so are not part of the dominator tree nor are they counted as part of the retained size. As they are not indexed they will not appear in the list objects query. Most other queries will not operate on unindexed (discarded) objects. Sometimes it is possible to view them. The inspector view can display unindexed objects in the attributes and statics tabs. It is possible to 'Go Into' an unindexed object from the inspector view, and 'Go Back' to the previous object. Unindexed objects do not have GC root information, so in that position in the inspector view is displayed a
 warning triangle
and the message Unindexed.
Names resolvers can use the values of unindexed objects to find a displayable
name for an object. This will be displayed after the object address
in the inspector view and in the
Inspector View value tab.
Some trial and error may be required to find suitable values of the options.
warning triangle
and the message Unindexed.
Names resolvers can use the values of unindexed objects to find a displayable
name for an object. This will be displayed after the object address
in the inspector view and in the
Inspector View value tab.
Some trial and error may be required to find suitable values of the options.- If an OutOfMemoryError still occurs on a parse then more objects need to be discarded, either by increasing the discard percentage or by increasing the number of types of discarded objects by changing the pattern.
- If the leak is not apparent from the snapshot with many discarded objects then examine the unreachable objects histogram to see if any key objects have been discarded and modify the discard pattern. Ideally only primitive arrays or objects which just have primitive fields or refer to primitive arrays should be discarded. This avoids disrupting the object graph too much.
- If the types of the discarded objects look reasonable then try changing which objects have been discarded, either by varying the offset (if the discard percentage is not 100) or the discard seed.
- If the available heap to run Memory Analyzer is very small then try discarding all of the ordinary objects by choosing 100 for the discard percentage and .* to match all object types. The resulting snapshot will not be useful for finding leaks, but the unreachable object histogram will show the types of the objects taking most of the heap space, and might give a hint as to the problem.
Note: This feature is experimental and is subject to change or removal. Please respond on the Memory Analyzer forum if you try it and find it useful or have suggestions.- Discard percentage
- A number between 0 and 100, treated as a percentage. Approximately this percentage of ordinary objects matching the discard pattern will be discarded by the HPROF or DTFJ parsers.
- Discard pattern
- Only objects with a class name matching this regular expression will be discarded. It is best to chose objects of a type which does not link to other objects, such as primitive arrays, or objects which just link to other such objects. This avoids breaking the object graph too much, and gives a hope that the leak analysis will find the problem. The default pattern of char\[\]|java\.lang\.String discards character arrays and Strings. For Java 9 heap dumps with compact strings based on byte arrays then byte\[\]|java\.lang\.String may be more appropriate.
- Discard offset
- A number between 0 and 99. This allows different objects to be discarded from two different parses of the same heap dump. This might be useful to allow objects which have been discarded from one snapshot to be found in the others. For example with a discard percentage of 25, then offsets chosen from 0,25,50,75 in successive parses will discard 4 distinct sets of objects. With a discard percentage of 80, and offsets of 0, 20, 40, 60, 80 in successive parses, will have each object present in one of those five snapshots.
- Discard seed
- This controls the starting point of the random number generator used to decide whether to discard particular objects. If after discarding objects the leak cannot be found then rerunning the parse with a different seed would discard some different objects and might show the leak better.
-
Normally stack frames are just shown in the Thread overview and stacks query.
This option allows stack frames to be treated as objects which are then visible like any other Java object in a Memory Analyzer view.
- Normal
- Stack frames are just shown in the Thread overview and stacks query.
- Only stack frames as pseudo-objects
-
Stack frames are of type
<stack frame>, size 0, with method names and source file and line numbers via fields and a name resolver.This is useful when looking at paths to and from objects via local variables as the stack frames are visible in the paths to GC roots queries.
- Stack frames as pseudo-objects and running methods as pseudo-classes
- Stack frames of are of type
packageName.className.methodName(Signature)ReturnTypeextending<method>representing the method being executed, of size the stack frame size, with source file and line number via fields and a name resolver, and those methods are pseudo-classes of type<method type>of size 0.This can be useful to find out which methods are currently running and how much stack space they take up. To examine running methods then take the histogram view, filter by '\(', then sort by instances or instance size.
- Stack frames as pseudo-objects and all methods as pseudo-classes
- Stack frames of are of type
packageName.className.methodName(Signature)ReturnTypeextending<method>codeph> representing the method being executed, of size the stack frame size, with source file and line number via fields and a name resolver, and all methods are pseudo-classes of type<method type>of size based on the JITted and byte code sizes. The method sizes are then not part of the class size.This can be useful to find out which methods have large JITted or byte code sizes. They can be viewed by going to the histogram view, then selecting
<method type>and listing objects.
- By default, when MAT parses IBM system dumps, the size of classes includes some of the amount of native memory in the Java process (but outside of the Java heap) which is related to those classes such as native memory for bytecode and JIT compiled code for the class methods. Check this option to disable this calculation and only report Java heap usage.
-
By default, the HPROF parser runs in strict mode. This means that
any deviation in the file from the
HPROF specification
is treated as a severe error, an exception is thrown, and dump
processing stops. There is one exception to this rule which is
that we can reliably workaround the observed issue in
bug #404679
.
This is a change in behavior from previous releases when a warning was shown in the error log and processing continued. This default change was made to alert the user to a potential problem either with the file itself or a bug in the JVM or in MAT. You may choose to change the strictness of the parser:
- Strict
- Default. Any deviation from the HPROF specification causes an exception to be thrown and processing to stop (with the exception of bug #404679 .) This option may be specified on the command line with -DhprofStrictnessStop=true
- Warning
- Choose this option to revert to the old behavior where a warning is printed to the error log and processing continues. This option is not recommended because the warning is probably a sign of a problem. Please open a bug report instead. This option may be specified on the command line with -DhprofStrictnessWarning=true
- Class objects have hidden references to the other objects. These include the signers and the protection domain. Memory Analyzer can include them via pseudo-fields named <signers> and <protectionDomain>. Sometimes it might be useful to see these references, and this option allows that.
-
Normally stack frames are just shown in the Thread overview and stacks query.
This option allows stack frames to be treated as objects which are then visible like any other Java object in a Memory Analyzer view.
- Normal
- Stack frames are just shown in the Thread overview and stacks query.
- Only stack frames as pseudo-objects
-
Stack frames are of type
<stack frame>, size 0, with method names and source file and line numbers via fields and a name resolver.This is useful when looking at paths to and from objects via local variables as the stack frames are visible in the paths to GC roots queries.
- Stack frames as pseudo-objects and running methods as pseudo-classes
- Stack frames of are of type
packageName.className.methodName(Signature)ReturnTypeextending<method>representing the method being executed, of size an estimate of the stack frame size, with source file and line number via fields and a name resolver, and those methods are pseudo-classes of type<method type>of size 0. The size of a stack frame is estimated as 8 bytes times the maximum number of object references from a frame of that type.This can be useful to find out which methods are currently running and how much stack space they take up. To examine running methods then take the histogram view, filter by '\(', then sort by instances or instance size.
- Modify the color of comments in the Object Query Language (OQL) studio.
- Modify the color of keywords in the Object Query Language (OQL) studio.
-
This is an option from the Eclipse IDE.
Use this option to specify what system command is executed in
Heap
Dump
History
for
Show in File System
. The main use is for
Platform defaults:
- Windows
- explorer /E,/select=${selected_resource_loc}
- Linux
- dbus-send --print-reply --dest=org.freedesktop.FileManager1 /org/freedesktop/FileManager1org.freedesktop.FileManager1.ShowItems array:string:"${selected_resource_uri}" string:""
- Mac
- open -R "${selected_resource_loc}"
- ${selected_resource_loc}
- absolute path to the resource
- ${selected_resource_uri}
- file: URI for the resource
- ${selected_resource_parent_loc}
- absolute path to the parent directory
- This configures the file encoding used for the following:
- Report HTML/CSV/Text file output
- Export HTML/CSV/Text file output
- Queries reading settings from files:
- Customized Retained Set -xfile
- Compare Tables and Trees
- Find Leaks between Snapshots