There is no exact algorithm for memory analysis. The following table divides existing heap dump queries by the usage categories.
Overview
| Histogram |
Class histogram is a list of all the objects in
the heap dump. You see the number of objects,
shallow and retained sizes for every class. The
sorting order of the list can be changed by
clicking the column header. Histogram gives you
a good starting point for further analysis.
Histogram can be opened by pressing the toolbar
button
 or by activating the action link on the Overview
pane. See the Basic Tutorial
for more information.
|
| Top Consumers | Top Consumers query returns information about the biggest objects grouped by class, class loader, and package as HTML page. The total heap is included in the analysis. |
| Heap Dump Overview |
When a heap dump is opened the Overview editor already provides a first analysis on the heap dump:
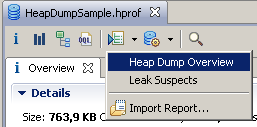
The Heap Dump Overview report can be opened via the toolbar: 
Overview report contains a histogram and a top consumers overview. |
| List Objects |
This shows the selected objects in a tree view.
With each object the class specific name of the referenced object is
also shown, if it is a known type such as
The icon shows whether the object is a
With the standard mode then expanding an object
shows the outbound references in rows below
and to the right of the object,
indicated by
the field name or array index as a prefix in bold.
The icons have an arrow which points down and to the right
In inbound mode the query shows which objects point to the
expanded object. In this mode the arrows on the icons
point up and to the left
|
| Show Objects by Class |
This works rather like the List objects
query except that it groups objects of the same class at
the same level into one row.
The inspector view shows the actual class; the context menu
allows operations on all the objects of that class in that row.
The color of the class icon shows if all the objects in that
row are new or not. If the icon is
This query can also operate in inbound mode. |


 .
.


