An easy way to start looking for areas for optimization is to use the Component Report. Additionally, the following queries may be useful to perform the analysis manually:
| Class Histogram |
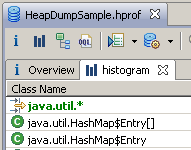
Memory Analyzer provides a developer with a
possibility to focus on a particular piece
of code by using filters in the Class
Histogram:
 |
| Retained Set | Looking what a set of objects retains (how much memory and what types of objects) may give some ideas where to optimize. |
| Collections query group | A number of queries provided under the Collections query group give the opportunity to analyze the ways collections are used e.g. how much they are filled, what the sizes are, what the collision ratio (for hash maps) is, etc... See Analyzing Java Collection Usage. |
| Group by Value | The Group by Value query provides the possibility to group a set of objects by the value of a certain field. It is very useful for searching redundant data. |
| Immediate Dominators |
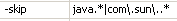
When you have found a suspect, that consumes
a lot of memory, you can use the dominators
query to find out what keeps this suspect in
memory. With this query you can also skip
the dominators that are of no interest for
you, e.g.
java.*
packages:
 image> |
| OQL |
The two most common ways to "waste" memory are:
|