Analyze a component for possible memory waste and other inefficiencies.
Introduction
A heap dump contains millions of objects. But which of those belong to your component? And what conclusions can you draw from them? This is where the Component Report can help.
Before starting, one has to decide what constitutes a component. Typically, a component is either a set of classes in a common root package or a set of classes loaded by the same class loader .
Using this root set of objects, the component report calculates a customized retained set. This retained set includes all objects kept alive by the root set. Additionally, it assumes that all objects that have become finalizable actually have been finalized and that also all soft references have been cleared.
Executing the Component Report
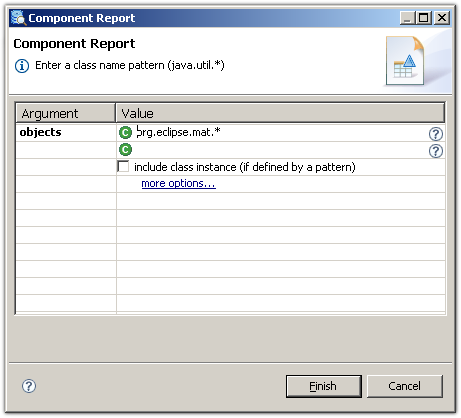
To run the report for a common root package, select the component report from the tool bar and provide a regular expression to match the package:
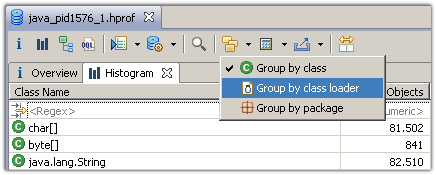
Alternatively, one can group the class histogram by class loader and then right-click the appropriate class loader and select the component report:
Overview
The component report is rendered as HTML. It is stored in a ZIP file next to the heap dump file.
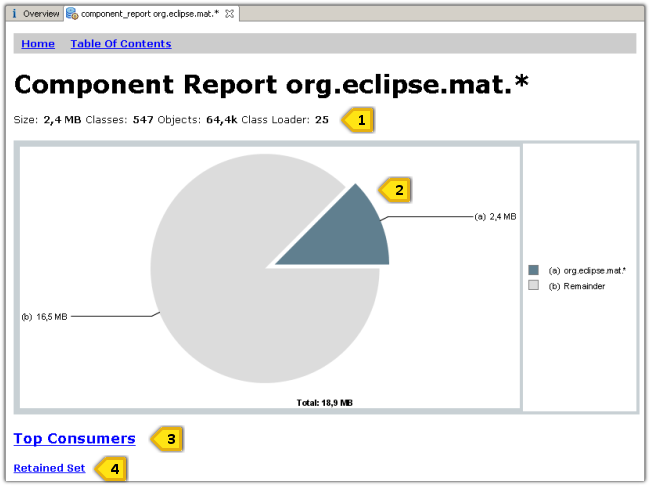
- Details about the size, the number of classes, the number of objects and the number of different class loaders.
- The pie chart shows the size of the component relative to the total heap size. See Pie Chart Links for links from pie charts.
- The Top Consumers section lists the biggest object, classes, class loader and packages which are retained by the component. It provides a good overview of what is actually kept alive by the component.
- Retained Set displays all objects grouped by classes which are retained.
Duplicate Strings
Duplicate Strings are a prime example for memory waste: multiple char arrays with identical content. To find the duplicates, the report groups the char arrays by their value. It lists all char arrays with 10 or more instances with identical content. Java 9 introduced compact strings, using byte arrays to represent the string value. This section also includes those byte arrays which are dominated by a string.
-
Sometimes the duplicate strings are used as
keys or values in hash maps
. For example, when reading heap dumps, MAT itself used to read
the char constant denoting the type of an attribute into memory.
It turned out that the heap was littered with many 'L's for
references, 'B's for bytes, and 'Z's for booleans, etc. By
replacing the
charwith anint, MAT could save some of the precious memory. Alternatively, Enumerations could do the same trick. -
When reading
XML documents
, fragments like
UTF-8, tag names or tag content remains in memory. Again, think about using Enumerations for the repetitive content. -
Another option is
interning
the String. This adds the string to a pool of strings which is
maintained privately by the class
String. For each unique string, the pool will keep on instance alive. However, if you are interning, make sure do it responsibly : A big pool of strings will have maintenance costs and one cannot rely on interned strings being garbage collected.
Empty Collections
Even if collections are empty, they usually consume memory through their internal object array. Imagine a tree structure where every node eagerly creates array lists to hold its children, but only a few nodes actually possess children.
One remedy is the lazy initialization of the collections: create the collection only when it is actually needed. To find out who is responsible for the empty collections, use the immediate dominators command. See the Collections Grouped by Size query.
Collection Fill Ratios
Just like empty ones, collections with only a few elements also take up a lot of memory. Again, the backing array of the collection is the main culprit.
The examination of the fill ratios using a heap dump from a production system gives hints to what initial capacity to use. To find out who is responsible for the collections with only a few elements, use the immediate dominators command. See the Collection Fill Ratio query.
Zero-Length Arrays
Even if arrays have a zero length they still consume memory. Arrays of length 1 might be replaced by a direct reference to the object, depending on whether that part of the code never refers to bigger arrays or whether some other code updates the contents of the array.
One remedy is the lazy initialization of the arrays: create the array only when it is actually needed. Another remedy is to use a singleton empty array. Consider if the objects need to be distinct (perhaps used as keys into a hash map) before making the change. To find out who is responsible for the zero-length arrays, use the immediate dominators command. See the Arrays Grouped by Size query.
Array Fill Ratios
Just like empty ones, arrays with only a few elements
also take up a lot of memory. The examination of the fill ratios
using a heap dump from a production system gives hints to what
size of array to use. The remedy depends on whether other code
refers to entries by index, in which case it might be possible
just to reallocate an array up to the last occupied index,
using for example Arrays.copyOf()
or whether the code just walks through the array, and the array
could be replaced by a copy with just the non-null entries.
To find out who is responsible for the arrays with many empty entries, use the immediate dominators See the Array Fill Ratio query
Primitive Arrays with a Constant Value
boolean[]byte[]char[]short[]int[]float[]long[]double[]
0, false or nul
then perhaps the array has not been used yet.
If the array is a fixed non-default value then perhaps the array could be
replaced by a reference to that value.
To find out who is responsible for the arrays with many empty entries, use the immediate dominators See the Primitive Arrays with a Constant Value query
Soft Reference Statistics
- Usually objects are cached, because they are expensive to re-create. Across a whole application, soft referenced objects might carry very different costs. However, the virtual machine cannot know this and clears the objects on some least recently used algorithm. From the outside, this is very unpredictable and difficult to fine tune.
- Furthermore, soft references can impose a stop-the-world phase during garbage collection. Oversimplified, the GC marks the object graph behind the soft references while the virtual machine is stopped.
- Comment
An example is the following:
A total of 217,035 java.lang.ref.SoftReference objects have been found, which softly reference 38,874 objects.
77,745 objects totalling 20.8 MB are retained (kept alive) only via soft references.
No objects totalling 0 B are softly referenced and also strongly retained (kept alive) via soft references.
- Histogram of Soft References
These are the reference objects which are instances of a type or subclass of
java.lang.ref.SoftReference - Histogram of Softly Referenced These are the objects which the referent fields point to.
- Only Softly Retained These are all the objects retained the objects in the Only Softly Retained table. All these objects could be freed in the next garbage collection cycle if the VM was short of memory.
- Referents strongly retained by soft reference These could indicate a possible memory leak, as the referent field can never be cleared while there is a strong path from the soft references to the referenced objects.
- If there are objects in the Referents strongly retained by soft reference
table then the Reference Leak
is run to examine the possible leaks in more detail.
Note: This might not show the same problems because the initial report Referents strongly retained by soft reference is done for all references of a particular type whereas the Reference Leak query operates on individual references.
Weak Reference Statistics
Weak references are cleared by the virtual machine when the
object referred to by the referent is no longer strongly reachable
or softly reachable
via another path.
Usually, weak references are used to retain extra data associated
with an object in a java.util.WeakHashMap
or to maintain a canonical mapping as the canonical object can
be retrieved if it is in use anywhere, but if no longer in use
then the mapping table will not keep it alive.
The report follows the format of the Soft Reference section above. An example of the comment is:
A total of 620 java.lang.ref.WeakReference objects have been found, which weakly reference 436 objects.
No objects totalling 0 B are retained (kept alive) only via weak references.
Possible Memory Leak 301 objects totalling 7.1 KB are weakly referenced and also strongly retained (kept alive) via weak references.
Finalizer Statistics
finalize
method are included in the component report, because those objects
can have serious implications for the memory of a Java Virtual
Machine:
-
Whenever an object with finalizer is created, a corresponding
java.lang.ref.Finalizerobject is created. If the object is only reachable via its finalizer, it is placed in the queue of the finalizer thread and processed. Only then the next garbage collection will actually free the memory. Therefore it takes at least two garbage collections until the memory is freed. - When using Sun's current virtual machine implementation, the finalizer thread is a single thread processing the finalizer objects sequentially. One blocking finalizer queue therefore can easily keep alive big chunks of memory (all those other objects ready to be finalized).
- Depending on the actual algorithm, finalizer may require a stop-the-world pause during garbage collections. This, of course, can have serious implications for the responsiveness of the whole application.
- Last not least, the time of execution of the finalizer is up to the VM and therefore unpredictable.
Map Collision Ratios
This sections analyzes the collision ratios of hash maps. Maps place the values in different buckets based on the hash code of the keys. If the hash code points to the same bucket, the elements inside the bucket are typically compared linearly.
High collision ratios can indicate sub-optimal hash codes. This is not a memory problem (a better hash code does not save space) but rather performance problem because of the linear access inside the buckets. To find out who is responsible for the collections with a poor collision ratio, use the immediate dominators command. See the Map Collision Ratio query.