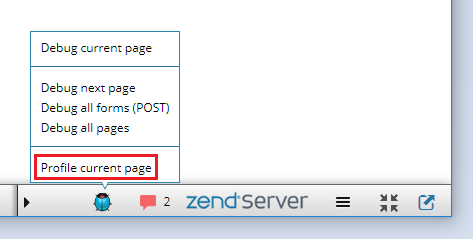
This procedure describes how to profile a PHP web application with the use of browser toolbars like Z-Ray or Zend Debugger Toolbar.
Profiling with Z-Ray
- Ensure the Z-Ray is enabled and running on your Zend Server.
- Open the web page you would like to profile in a browser.
- Ensure your PDT is open.
- Click the 'Bug' icon on the Z-Ray toolbar and select Profile current page option to profile the page currently displayed in the browser.

The relevant profile session will be launched in PDT.
- Ensure the Zend Debugger Toolbar is installed on your browser.
- Open the web page you would like to profile in a browser.
- Ensure your PDT is open.
- Click the 'Profile' icon on the Zend Debugger Toolbar to profile the page currently displayed in the browser.

The relevant profile session will be launched in PDT.
- Ensure the Xdebug helper or The easiest Xdebug is installed on your browser.
- Make sure xdebug.profiler_enable_trigger is enabled
- Open the web page you would like to profile in a browser.
- Ensure your PDT is open.
- Click the 'Profile' icon on the Xdebug Toolbar to profile the page currently displayed in the browser.
You Xdebug will create CacheGrind. Now you can import profile session


