Locally Profiling a PHP Script
This procedure describes how to profile a PHP Script from your workspace using an internal PHP Executable.
- Click the arrow next to the Profile button
 on the toolbar and select Profile Configurations... -or- from the main menu go to Run | Profile Configurations... -or-right-click in Project Explorer view and select Profile As | Profile Configurations...
 - A Profile launch configuration dialog will appear.
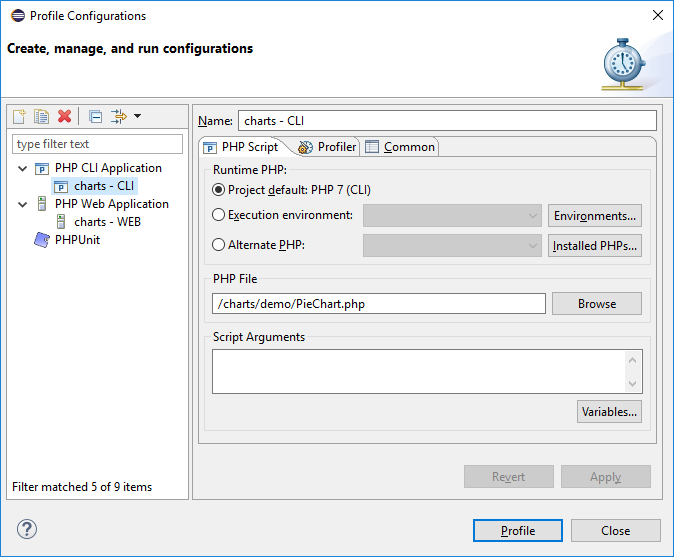
- Double-click the PHP CLI Application option to create a new Profile configuration.

- Enter a name for the new configuration.
- Select from the following options:
- Workspace default PHP - Select to use the workspace/project default PHP
- Execution environment - Select the execution environment you would like to use for your debug configuration from the dropdown list.
- Alternate PHP - Select to use another PHP which can be selected from the Installed PHP's list.
- Enter your PHP file in the PHP File text field, or click Browse and select your file.
- If necessary, you can add arguments in the PHP Script Arguments tab to simulate command line inputs.
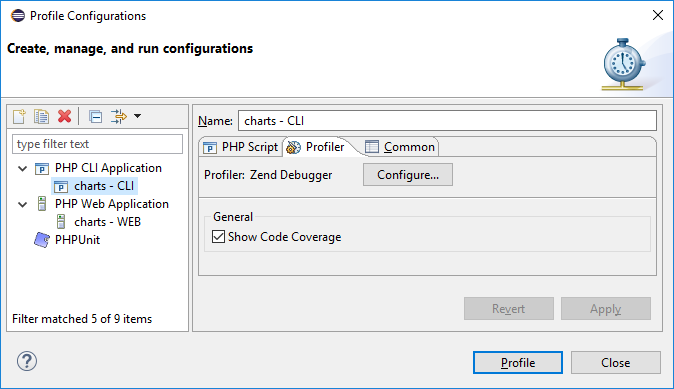
- Select Profiler tab and uncheck Show Code Coverage option if information about code coverage is not needed.

- Click Apply and then Profile.
- A confirmation dialog will be displayed asking whether you want to open the profiling perspective.
Click Yes. (If you would like the profiling perspective to open by default in the future, mark the 'Remember my decision' checkbox.)
The PHP Profile Perspective will open, displaying the Profiling Monitor window with various Profiling views.
See PHP Profile perspective for more on the information displayed once a profile session has been run.

