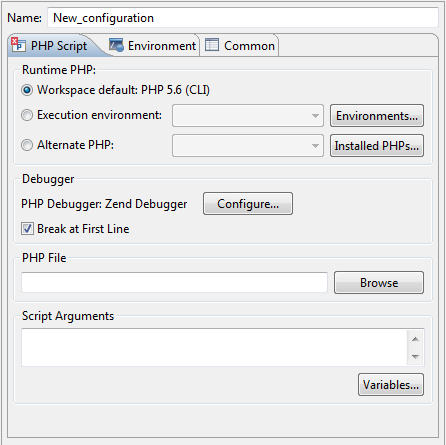
To locally debug a PHP Script:
- Set breakpoints at the relevant places in the file that you would like to debug by double-clicking the vertical marker bar to the left of the editor.
- Save the file.
- Click the arrow next to the debug button
 on the toolbar and select Debug Configurations... -or- select Run | Debug Configurations.... A Debug dialog will open.
 - Double-click the PHP CLI Application option to create a new debug configuration.

- Enter a name for the new configuration.
- Select the appropriate PHP Executable in Runtime PHP section. If no PHP Executables are available, click the Installed PHPs button and add a PHP Executable in the PHP Executable Preferences page.
- Enter your PHP file in the "PHP File" text field, or click Browse and select your file
- Marking the "Break at First Line" checkbox will result in the debugging process pausing at the first line of code.
- If necessary, you can add arguments in the Script Arguments section to simulate command line inputs.
- Click Apply and then Debug.
- Click Yes if asked whether to open the PHP Debug Perspective.
A number of views will open with relevant debug information.
See the Running and Analyzing Debugger results topic for more information on the outcome of a debugging process.