This tutorial has been updated for Eclipse Mars: Eclipse 4.5, EMF 2.11, OCL 6.0.
-
Some screenshots may be slightly out of date.
In this tutorial we will continue the OCLinEcore tutorial and show how to use the OCL debugger to debug:
-
constraints typed manually in the Console View
-
embedded OCLinEcore validation failures from the Validity View
-
Complete OCL validation failures from the Validity View
The material for the first two parts of this tutorial is available as part of the OCLinEcore Example project that you may load by selecting New then Example... using the right button context menu of the Project Explorer. This should give the New Example dialog in which you can select the OCL (OCL Constraint Language) Plugins and the OCLinEcore Tutorial.
The material for the third parts of this tutorial is available as part of the CompleteOCL Example project that you may load in a similar way.
The OCL debugger is a customization of the Eclipse debugger framework, so most of its functionality should present few surprises to those familiar with the Java debugger.
There is:
-
a Stack View that shows the current line number in nested Evaluation Environments
-
a Variables View in which local and intermediate variables can be re-examined
-
an Editor in which the source is highlighted to show the next AST node to be evaluated
-
an Outline in which the source is shown in tree form
-
a Breakpoints View in which breakpoints can be controlled
We will demonstrate some of these facilities by debugging a simple example.
We will debug the execution of the OCL expression self.name on an EPackage.
Double click on model/Tutorial.ecore to open the model and expand the top entry to show the EPackage.
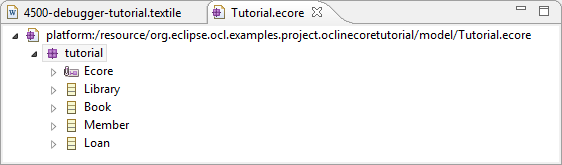
If the model opens with another editor, close it, and open with the Sample Ecore Editor by selecting model/Tutorial.ecore and then Open With->Sample Ecore Model Editor from the context menu.
Select the tutorial EPackage and invoke OCL->Show Xtext OCL Console from the context menu. (Wait a second or two.)
At the bottom of the Console window type self.name, then hit the Enter key. Then hit the Page Up key to redisplay your entry.
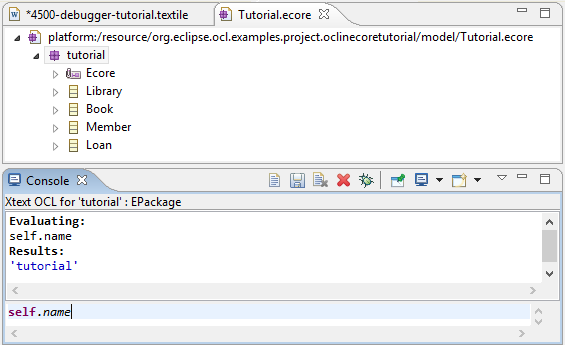
The Console runs an evaluation automatically after hitting Enter and shows the evaluation result: 'tutorial'.
The Console View provides the two pieces of information necessary to run the OCL debugger:
-
an EObject to be used as OCL’s self; the Console shows the current selection just below its tool bar
-
an OCL expression to execute
Start the debugger by clicking the debug icon in the Console View tool bar. (Wait a second or two.)
The debugger perspective should appear automatically. If it doesn’t, you can open the Debug perspective manually by invoking Window->Perspective->Open Perspective->Debug from the Eclipse menu bar.
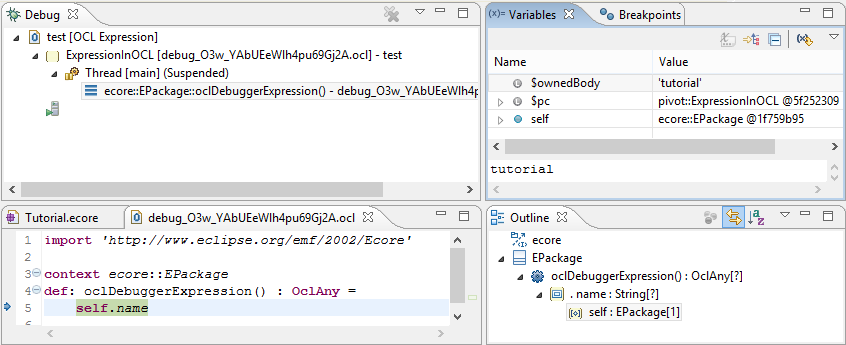
A Complete OCL document is created automatically to encapsulate the OCL expression inside as an additional operation for the type of the self object. This document is shown in the editor; it is readonly.
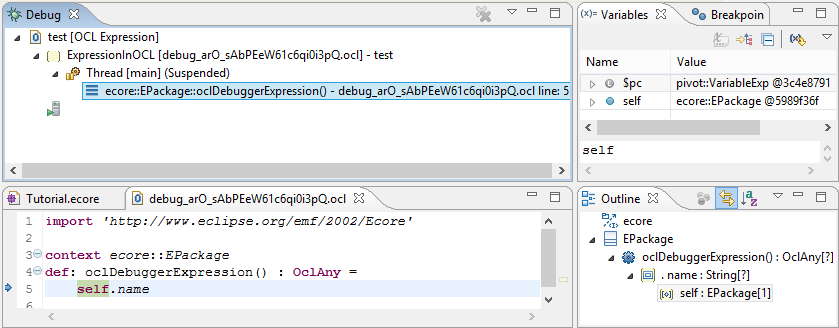
The stack display shows the context as line 5 of oclDebugExpression() in the synthesized Complete OCL document.
Select the oclDebugExpression() line in the stack display; self is highlighted in the Complete OCL document, since the next evaluation to perform is to evaluate the VariableExp AST node that performs the self access.
The Variables View shows two variables.
-
self is the OCL self object
-
$pc is a synthetic variable representing the current Program Counter
The Outline View displays a slightly trimmed OCL Abstract Syntax tree; you may choose to close this view. In a future release it may change to support breakpoints. The view shows
-
an Import for ecore
-
a Class named EPackage containing
-
an Operation named oclDebugExpression containing
-
an ExpressionInOCL whose OwnedBody is a PropertyCallExp for name and whose source is
-
a VariableExp for self.
The outline shows fuller type signatures to assist in debugging.
The Variables View provides an ability to drill down arbitrarily to examine the data available to your program.
The left column of the display presents the name of a variable and may be expanded to navigate to parts of the data referenced by the variable. Part name displays are currently shown 0-based, rather than 1-based as in OCL.
The right column variously displays the type of parts that can be expanded and the values of those that cannot. An OCL syntax is used so Strings appear in single quotes and Collections use names such as OrderedSet.
The bottom line shows a textual rendering of the selected variable. For many types of data a helpful rendering is available. For others the fallback is to the default Java toString() functionality. The text can be customized by
-
the org.eclipse.ocl.pivot.utilities.getText() method if the object implements Labelable
-
the LabelUtil.QUALIFIED_NAME_REGISTRY if an org.eclipse.ocl.pivot.label_generator extension point has a registration for the objects' class
Click on the expand/collapse icon to the left of $pc to expand it and allow inspection of the OCL AST. A VariableExp is next to execute and its $pc.referredProperty or $pc.type may be examined to see more program detail.
Click on the expand/collapse icon to the left of self, which is an ecore::EPackage, to expand it and shows its fields such as name which is 'tutorial'.
Click on the expand/collapse icon to the left of self.eClassifiers to show the four classifiers.
Select self.eClassifiers[ 1 ] so that the bottom line display shows that the second is named Book.
The Variables View provides more insight that the Sample Ecore Properties View, so you may find it convenient to use a trivial OCL debugger session using self as the OCL expression to browse arbitrary model data.
Click F5 or the Step Into icon to advance execution by one AST node evaluation.
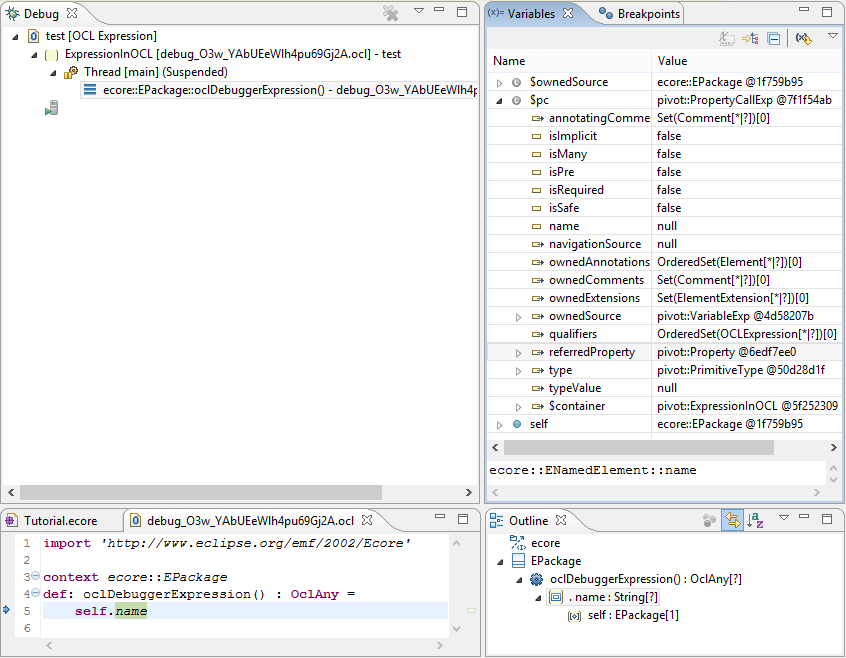
The editor now highlights .name; $pc shows a PropertCallExp as the next execution. $pc.referredProperty shows that it is ecore::ENamedElement:name.
An additional synthetic variable $owwnedSource shows the result of the self evaluation that forms the source term of the PropertyCallExp. As expected this is the same as self.
Click F5 or the Step Into icon again to advance execution by a further AST node evaluation.
The whole of self.name is highlighted and $pc shows that the overall ExpressionInOCL is about to be evaluated. The synthetic $ownedBody for its input shows that self.name evaluated to 'tutorial'.
OCL is useful for elaborating models with additional well-formedness rules, but when these fail it can be difficult to understand why a failure occurred, particularly if the bug is in the OCL rather than the model. We will now show how the OCL debugger can be used to debug a validation failure.
Double click on model/Tutorial.xmi to open the model, and expand the top two entries to show some detail.
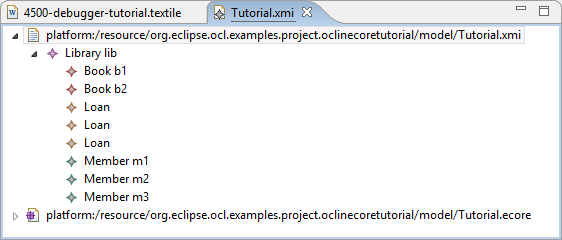
If the model opens with another editor, close it, and open with the Sample Reflective Ecore Model Editor by selecting model/Tutorial.xmi and then Open With->Sample Reflective Ecore Model Editor from the context menu.
Select the first line and invoke Validate from the context menu. (Wait a second.) Optionally click on Details.
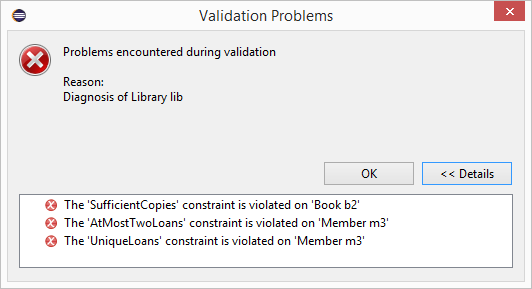
These error messages provide insufficient precision to really understand the problems, so click OK to dismiss the popup then select Book b2, which has an error, and invoke OCL->Show Validity View to provide more insight.
If the Validity View shows question marks rather than red/green/amber status decorations, Click the Run icon in the Validity View tool bar.
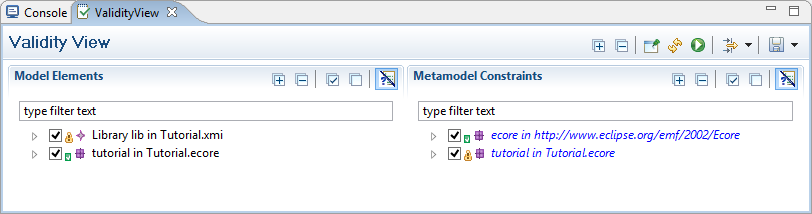
Click the Pin icon in the Validity View tool bar to avoid thrashing whenever you change mouse selection.
Uncheck the top ecore line in the Metamodel Constraints since we are not interested in the successful Ecore metamodel constraints just those in the tutorial metamodel.
Similarly uncheck the bottom tutorial line in the Model Elements since we are not interested in the successful metamodel, just those in the tutorial model.
Click on the + tool bar icon so that the detail is shown.
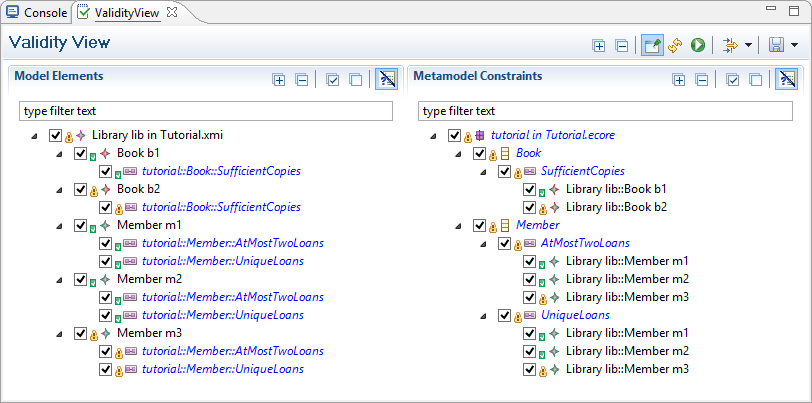
We will now debug the failure of the tutorial::Book::SufficientCopies on the Library lib::Book b2 model element. Select either of the leaf warnings, that is either the tutorial::Book::SufficientCopies child of Book b2 in the left hand pane, or the Library lib::Book b2 child of SufficientCopies in the right hand pane, and invoke Debug Single Enabled Selection. Wait a second or two and the debugger starts. If it doesn’t, open the Debugger perspective manually.
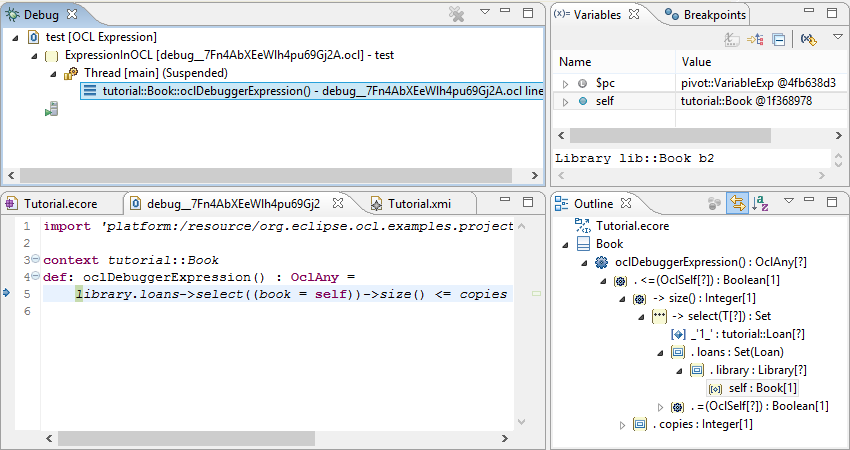
Select the oclDebuggerExpression() stack line. The debugger shows library.loans->select((book = self))->size() <= copies with l highlighted as the next execution. The outline shows that the VariableExp for self is next to execute. The library in the source code is a shorthand for self.library so highlighting l is an approximation to highlighting the invisible source. in front of library. $pc in the Variables View also shows a VariableExp for self as the next instruction.
Click F5 or Step Into and $pc advances and the editor highlight changes to library.
Click F5 or Step Into a few more times and the highlight will show the iteration within the select body, allowing each state of each element to be examined to determine why the exhibited behavior occurs.
Continue to Click F5 or Step Into until ->size() is highlighted.
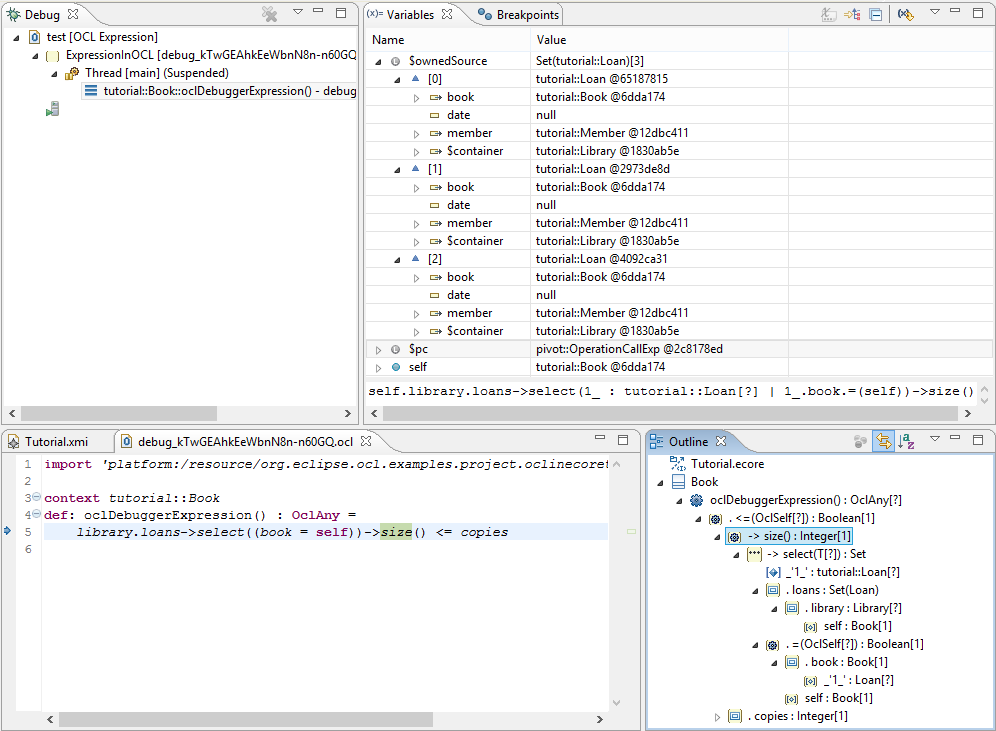
Expanding $ownedSource in the Variables View shows the Set of three selected Loans each of which has the same book as self.
Click F5 or Step Into three more times until <= is highlighted.
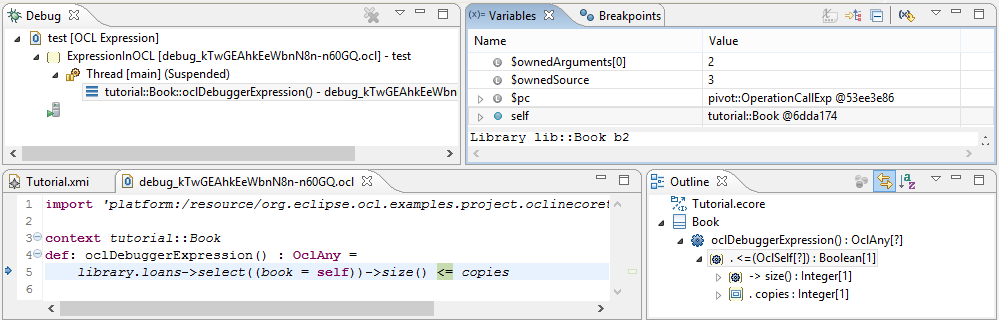
We can now see that the $ownedSource, left hand side, of the comparison is 3 and the $ownedArguments[0] right hand side is 2. A further step and we see the result as $ownedBody demonstrating why the validation failed.
The two preceding examples displayed their source text in a synthesized Complete OCL document.
In this example we debug a failure for which the OCL is already available in a Complete OCL document.
Open the model/EcoreTestFile.ecore from the Complete OCL tutorial project using the Sample Ecore Editor.
Within the Ecore editor use OCL->Load Document and then drag and drop model/ExtraEcoreValidation.ocl and click OK to dismiss the pop up.
Again within the Ecore editor use OCL->Show Validity View to see the constraint/element pairs. If the Validity View was already visible, close it and re-show it since in Mars addition of a Complete OCL document fails to refresh correctly.
In the Validity View, uncheck the ecore Metamodel Constraint contributions retaining just the ExtraEcoreValidation.ocl contribution. Click the plus icon in the Metamodel Constraint tool bar to expand all entries.
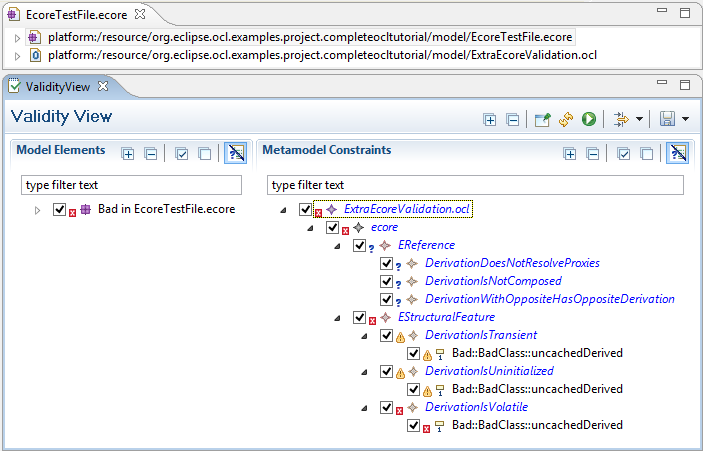
Select the bottom right BadClass model element below the DerivationIsVolatile constraint and invoke Debug Single Enabled Selection. from the context menu (wait a second or two). The debugger should start, if not open the Debugger perspective manually.
In Mars, select the DerivationIsVolatile stack line to refresh the selection.
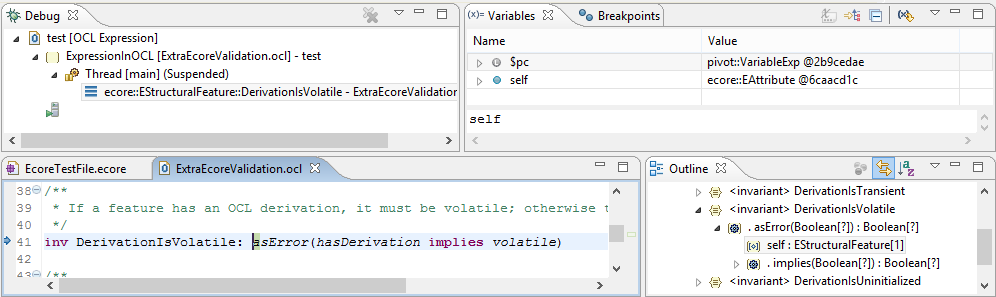
Both asError and hasDerivation are OCL-defined so as you step you successively navigate into the defined property and operation.
While debugging, the original OCL expression from the Console is presented in a Complete OCL editor. This editor is readonly so you cannot edit it to correct mistakes or to experiment.
You may however safely use the OCL Console to perform further experiments. Select a suitable self object in the Variable View and cut and paste to prepare your experimental OCL expression.
In Mars, Console selections cannot be Collections so you are unfortunately restricted to single objects.
In the examples above we have only used F5 or Step Into.
In principle the tedious stepping through an iteration can be avoided by F7 or Step Return which should terminate on the popped evaluation environment at the end of the iteration. This facility has not been adequately tested in Mars.
If you arrange for some line breaks in your source text you can use F6 or Step Next to proceed until the line number advances. This facility has not been adequately tested in Mars. Line breaks can be added in the OCL Console using Shift and Enter together.