The OCL debugger supports debugging OCL constraints. It is a customization of the standard Eclipse debugger and so most of the facilities should be familiar to users of the Eclipse Java debugger.
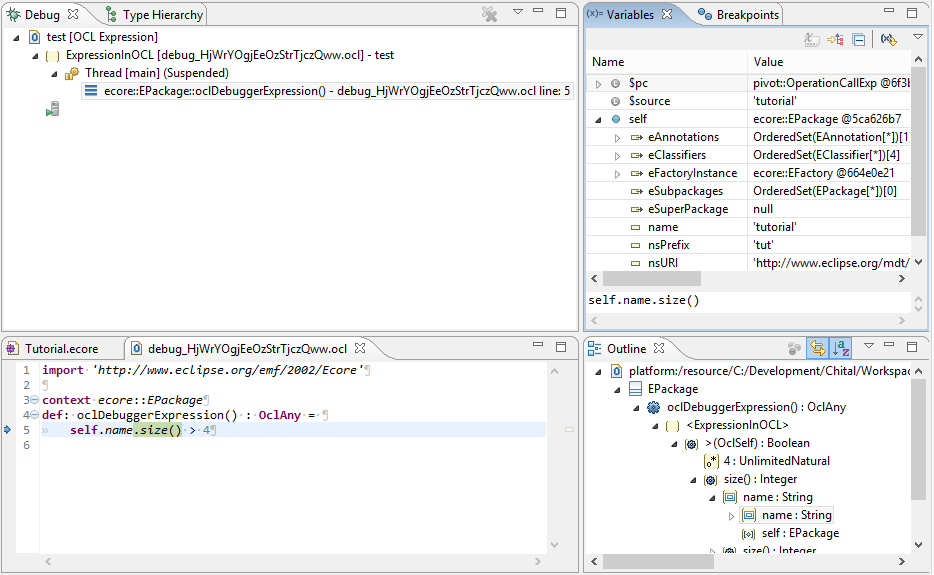
The screenshot shows
-
Debug Stack Trace showing the context of nested evaluation environments
-
Variables View showing intermediate and local variables
-
Editor showing input and context after a couple of steps
-
Outline showing the Concrete Syntax Tree context
The OCL Debugger is very new, there are no doubt many opportunities for ergonomic improvements and bug fixes. Please raise a Bugzilla .
Launching the debugger for an OCL constraint requires the user to provide two pieces of information
-
the expression or constraint to evaluate
-
the self object upon which to operate
These may be provided in a variety of ways
An arbitrary OCL expression may be entered in the Xtext OCL Console and evaluated on a model object selected using a mouse selection. The Debugger is invoked from the debug icon on the Console Tool Bar.
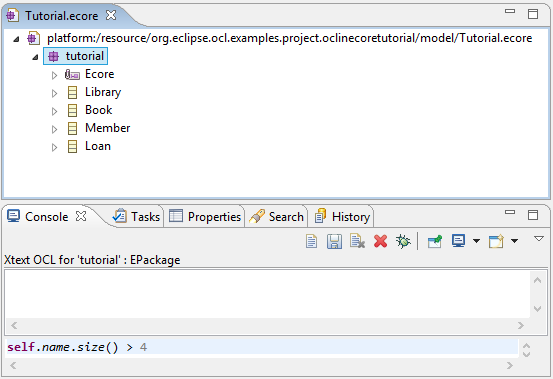
Clicking the debug icon creates a dummy Complete OCL file and then launches the debugger. The expression is encapsulated as an oclDebugExpression operation extension to the type of the selected object. The file provides the source for source level debugging. The console may be re-used while debugging.
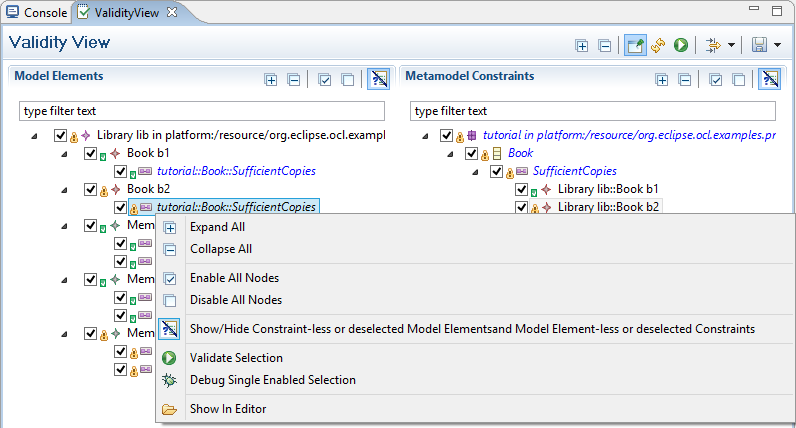
The Validity View provides fine-grained display of the evaluation of each constraint applicable to a model element and vice-versa. One of these model element/constraint combinations may be selected and the debugger launched using Debug Single Enabled Selection to investigate why validation is producing unexpected results.
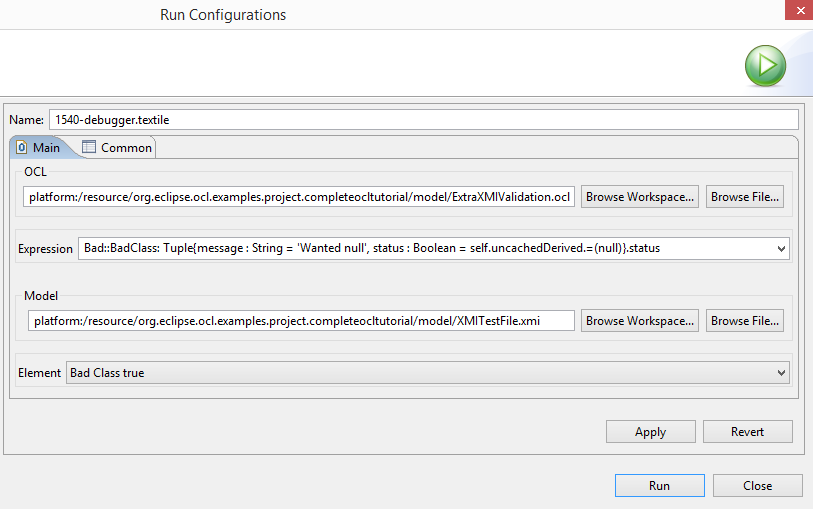
An OCL Expression launch configuration may be created to select a model element and a constraint for execution or debugging.
The launch configuration may be created using Run->Run Configurations... or Debug->Debug Configurations... from the Eclipse Menu Bar. This requires both Model Element and Constraint to be selected separately.
Alternatively the context menu in model editors offers an OCL->Debug... option that creates a Debug Configuration in which the Model Element is pre-selected from the invoking context.
OCL expressions can be very compact and generally occur embedded in a larger application. The debugger is therefore optimized for this usage.
Rather than the line-based stepping typical of the Java debugger, the OCL debugger supports term by term stepping, highlighting the next term to be evaluated and showing the intermediate results as $-prefixed names in the Variables View.
The OCL debugger interpretation of the Step functionalities is adjusted to facilitate stepping to many points in a complex expression without needing to reformat the source with line breaks..
The Example Debugger View shows the imminent execution of “.size()” after stepping into “self” and “.name”.
A single OCL AST node is executed. The results can be inspected as inputs of a subsequent AST node.
Execution proceeds until the next OCL AST node is associated with a new source line number.
Execution proceeds until the next OCL AST node is associated with a reduced stack depth. Iterations introduce nested stack entries so step return can step out of an iteration. let expressions and nested OCL calls also introduce additional stack nesting.
The Variables View enables the local variables and intermediate results to be examined using OCL syntaxes such as single quotes for Strings.
The Example Debugger View shows the “self” variable, which is an “ecore::Package” instance, opened to show its fields, amongst which the name is ‘tutorial’.
Intermediate variables are named using the property name of the subsequent AST node’s input. Thus “$source” shows the OperationCallExp.source input already computed as “self.name”. Multiple inputs are diasmbiguated by suffixing as in “$argument[0]”.
“$pc” identifies the next instruction, which can be examined in just the same way as any other variable.
Line breakpoints can be set in the Complete OCL editor and examined in the Breakpoints View. Execution stops when an OCL AST node has been executed that is associated with the line of a breakpoint.
No filtering facilities are yet available.