

| Using Memcheck | ||
|---|---|---|
|
|
|
|
| General Usage | Using Massif | |
Memcheck is the default tool used by Valgrind and the Valgrind plug-in for Eclipse. It allows you to detect memory-related problems such as memory leaks, use of uninitialized memory, and reads from/writes to inappropriate stack areas. For more information about Memcheck, refer to http://www.valgrind.org/docs/manual/mc-manual.html.
Any memory management errors detected by Memcheck are displayed in the Valgrind view, which appears automatically after a profile run. Each displayed error can be expanded in the Valgrind view to display its stack trace.
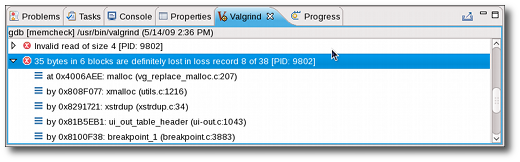
In some cases, Memcheck can determine which section of the source code causes a reported error. Whenever this is the case, double-clicking on the stack trace of the reported error will open the related source file and place the insertion point on the line responsible for the error.
To configure a Memcheck profile run, navigate to Profiling Tools > Profile Configurations to access the
Profile Configurations
menu. In the
Valgrind Options
tab, navigate further to
Memcheck Options
.
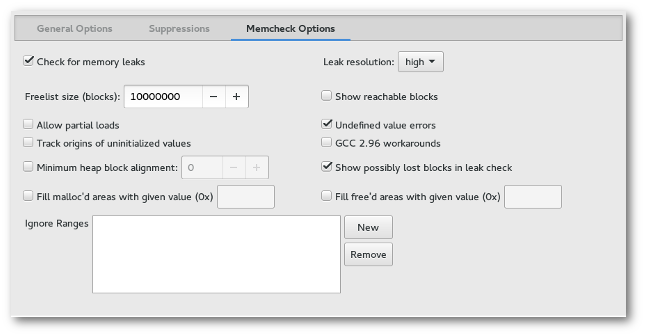
The Memcheck Options tab allows you to configure the following Memcheck options:
--leak-check= option with only the values "yes" or "no" supported. When enabled, Memcheck will search for memory leaks when the client program finishes and will show each individual leak based on the settings of
show reachable blocks
and
show possibly lost blocks
.
--leak-resolution= and sets how tolerant Memcheck should be in considering different stack traces to be the same. The default setting is "low", which means only the first two entries need to match. The "med" setting requires four entries to declare a match. The "high" setting requires all entries to declare match.
--freelist-vol=, which specifies the maximum total size (in bytes) of memory blocks to be marked "inaccessible" once they have been freed using free (as in C) or delete (as in C++). The default value for
freelist size (blocks)
is 10000000.
--alignment=, which specifies the minimum alignment/size of heap blocks. The default value for this option is 8.
--show-reachable and configures whether or not Memcheck should report all types of leaks (option true) or only show definitely lost / possibly lost blocks (option false) based on the value of
show possibly lost blocks
. The default value of this option is false.
--show-possibly-lost and configures whether Memcheck should report 'possibly lost blocks' in addition to 'definitely lost blocks' if
show reachable blocks
is set to false. If
show reachable blocks
is true, then this setting is ignored as all leak block types are reported. The default value of this option is true.
--undef-value-errors and specifies whether or not Memcheck should detect dangerous uses of undefined value errors. This is enabled by default.
--track-origins= which specifies whether Memcheck tracks the origin of uninitialized values or not. By default, Memcheck does not track uninitialized values.
--partial-loads-ok=, which controls how Memcheck handles word-sized, word-aligned loads from addresses from which bytes are addressable and others are not. This is disabled by default (i.e. treat loads from partially invalid and completely invalid addresses as the same).
--workaround-gcc296-bugs, which controls whether Memcheck should assume that small reads/writes below the stack pointer are due to bugs in
gcc-2.96. This option is disabled by default (i.e. do not assume them to be reslting from
gcc-2.96 bugs; report such reads/writes as errors).
--freefill=. A hex byte is specified that is used by Memcheck to fill blocks freed by free, delete. This can be used to determine obscure memory corruption problems.
--mallocfill=. A hex byte is specified that is used by Memcheck to fill blocks allocated by malloc, new, etc, but not by calloc. This can be used to determine obscure memory corruption problems.
--ignore-ranges=. Any ranges listed in this option will be ignored by Memcheck's addressability checking.
Refer to
http://www.valgrind.org/docs/manual/mc-manual.html#mc-manual.suppfiles for information about Memcheck suppression files. For more information about each Memcheck option in the Valgrind plug-in for Eclipse, refer to man valgrind.
|
|

|
|
| General Usage | Using Massif |