Debugging a project
The debugger lets you control the execution of your program by setting breakpoints, suspending executed programs, stepping through your code, and examining the contents of variables.
To debug a project:
-
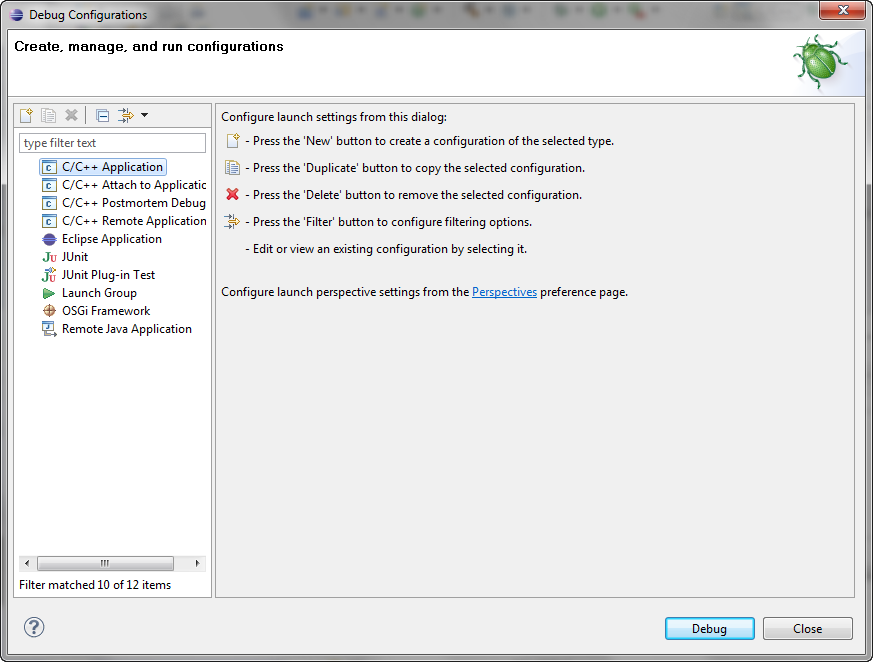
Click the Run > Debug Configurations… menu option.
The Debug Configurations dialog opens.

-
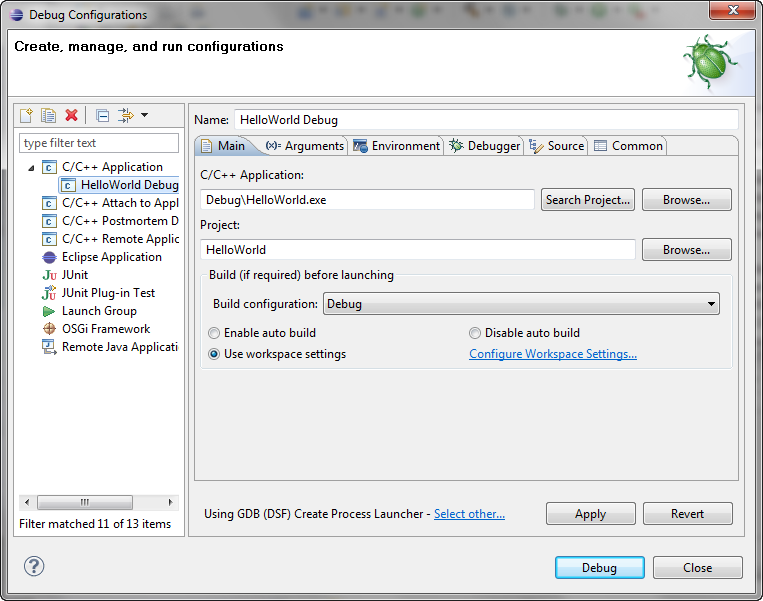
Double-click C/C++ Application to create a new launch configuration.

If a project is selected in the Project Explorer view the following data is automatically entered, take a moment to verify its accuracy or change as needed.
-
In the Name edit box, type the project name, like Hello World.
You can now select this debug launch configuration by name the next time that you debug this project. -
In the C/C++ Application edit box, type the name of the executable if its not already entered.
If not, click the Search Project button to locate the executable in the project. -
In the Project edit box, type or choose your project, e.g. HelloWorld.
NOTE If you see the error "[Debugger]: No debugger available", select the Debugger tab and choose a valid debugger for your platform (e.g. gdb/mi).
-
-
Click Debug.
You may be prompted to switch to the Debug perspective. Click YesThe Debug perspective appears with the helloworld.exe application window open. The C/C++ editor repositions in the perspective.
NOTE: If you see the error "Can’t find source file" in the editor view, use the Locate File button to locate your source file.
-
In the left margin of the main.cpp window, double-click to set a breakpoint on: cout << "You just entered"
You’ll see a blue circle ( )
there indicating the breakpoint is set.
-
Click Run > Resume.
Or, you can use the Resume button ( ) on the
toolbar of the Debug view .
-
When prompted, in the Console view, type a value other than 'm', and press Enter.
The breakpoint will be hit. -
In the Variables view, verify that the variable is not 'm'.
-
Click Run > Resume.
-
When prompted, again type a value other than 'm' in the Console view, and press Enter.
The breakpoint will be hit.
-
In the Variables view, verify that the variable is not 'm'.
-
In the Variables view, right-click the input variable, and select Change Value… and type 'm' between the single quotes and hit OK.
-
Click Run > Resume.
The output in the helloworld.exe application window is: "Thank you. Exiting."
-
The application terminates and the debug session ends. The Debug perspective remains open.
To learn more about debugging, see the related debug conceptual topics.
![]()
![]()
![]()