A detailed description of the architecture and basic concepts of Graphiti can be found here.
In the terms of Graphiti “add” means to add a graphical representation of an existing domain model object (= business object) to the diagram. What kinds of business objects can be added to a diagram of a specific type is decided by the add features delivered by the feature provider.
For our example the graphical representation of a EClass is illustrated in the Figure. We want to see a rounded rectangle containing a separator like horizontal line and above that line the name of the corresponding EClass.
Figure: Graphical representation of a EClass
Graphiti supports a kind of linkage between elements of the domain model and elements of the model defining the graphical representation – the so called Pictograms Model. These links are called pictogram links. Each diagram contains one container for all pictogram links – called diagram link.
You can see the linkage structure of the example in the Figure: Column one shows the entity model of the graphical representation of exactly one EClass. A container shape aggregates two child shapes (a container shape itself can be aggregated in another container shape or in a diagram). All three shapes themselves aggregate specific graphics algorithms, providing the complete information to allow the rendering on a screen. Examples for this information are background color, foreground color, size, position, visibility and line width. In our example we have a rounded rectangle providing an additional corner radius, a polyline having defined end- and bendpoints and a text label containing a text value.
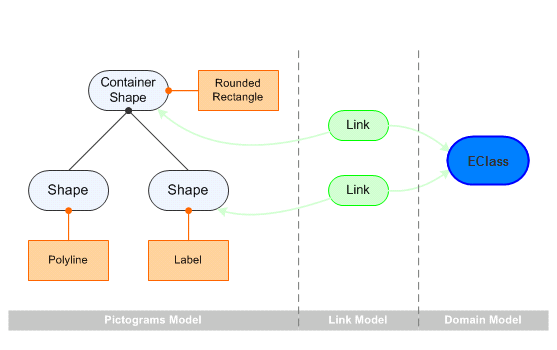
Figure: Linkage structure example
The container shape and likewise the shape containing the text label are related to a corresponding EClass. This relationship is realized through special link objects (pictogram link) holding references to both sides: to the pictograms side and to the business side.
Before we can program our first add feature, we need to know which coordinate system is used by Graphiti for the positions (locations) in the graphics algorithms.
Note: Graphiti always uses relative Cartesian coordinates. That means, the graphical objects are placed in a coordinate system which defines its origin coordinates — normally (0,0) — on the top left. The coordinate system of graphics algorithms for active shapes is always relative to the next active parent container shape while the coordinate system of graphics algorithms of inactive shapes is relative to their direct parent container shape. Every graphics algorithm has a parent, except the graphics algorithm of the diagram. The location of a graphics algorithm is defined by (x,y) and the size by (width, height).
When a shape is moved, its location is updated by the default features of the framework, but the children come along without any changes of its locations.
If a shape is transformed, default features and resize functionality is done by the framework, but a layout feature has to be provided, which recalculates the locations and sizes of the children. Otherwise children would be clipped, when their size exceeds their parent and they are not transformed accordingly. There is intentionally no default implementation for this recalulations, because there are different methods to achieve it.
The rendering engine of Graphiti uses utility methods on IFigure to convert relative coordinates to absolute coordinates, when it calls methods of Draw2d.
In this example we want to enable the editor’s users to add EClasses to the diagram. As a result it should be possible to drag an EClass from the tree and drop it on the diagram. Therefore we have to create an add feature and make it available in the feature provider.
An add feature has to implement the interface IAddFeature. Instead of implementing it directly it should extend one of the available base classes. In this example we extend the base class AbstractAddShapeFeature.
In this case we have to implement/overwrite two methods:
Additionally we have to create graphics algorithms and place them at the appropriate location (get location from given context). Additionally, the name of the EClass has to be set as the text label’s value.
You can see the complete implementation of the add feature here:
package org.eclipse.graphiti.examples.tutorial.features;
public class TutorialAddEClassFeature
extends AbstractAddShapeFeature {
private static final IColorConstant
E_CLASS_TEXT_FOREGROUND =
IColorConstant.BLACK;
private static final IColorConstant
E_CLASS_FOREGROUND =
new ColorConstant(98, 131, 167);
private static final IColorConstant
E_CLASS_BACKGROUND =
new ColorConstant(187, 218, 247);
public TutorialAddEClassFeature(IFeatureProvider
fp) {
super(fp);
}
public boolean canAdd(IAddContext context)
{
//
check if user wants to add a EClass
if (context.getNewObject()
instanceof EClass) {
// check if user wants to add to a diagram
if (context.getTargetContainer()
instanceof Diagram) {
return true;
}
}
return false;
}
public PictogramElement add(IAddContext context)
{
EClass addedClass = (EClass)
context.getNewObject();
Diagram
targetDiagram = (Diagram) context.getTargetContainer();
// CONTAINER SHAPE WITH ROUNDED RECTANGLE
IPeCreateService peCreateService = Graphiti.getPeCreateService();
ContainerShape containerShape =
peCreateService.createContainerShape(targetDiagram,
true);
// define a default size for the shape
int width = 100;
int height = 50;
IGaService gaService = Graphiti.getGaService();
RoundedRectangle roundedRectangle; // need to
access it later
{
// create and set graphics algorithm
roundedRectangle =
gaService.createRoundedRectangle(containerShape, 5, 5);
roundedRectangle.setForeground(manageColor(E_CLASS_FOREGROUND));
roundedRectangle.setBackground(manageColor(E_CLASS_BACKGROUND));
roundedRectangle.setLineWidth(2);
gaService.setLocationAndSize(roundedRectangle,
context.getX(), context.getY(), width, height);
// if added Class has no resource we add it to the
resource
// of the diagram
// in a real scenario the business model would have its own resource
if (addedClass.eResource() ==
null) {
getDiagram().eResource().getContents().add(addedClass);
}
// create link and wire it
link(containerShape, addedClass);
}
// SHAPE WITH LINE
{
// create shape for line
Shape shape = peCreateService.createShape(containerShape,
false);
// create and set graphics algorithm
Polyline polyline =
gaService.createPolyline(shape, new int[] {
0, 20, width, 20 });
polyline.setForeground(manageColor(E_CLASS_FOREGROUND));
polyline.setLineWidth(2);
}
// SHAPE WITH TEXT
{
// create shape for text
Shape shape = peCreateService.createShape(containerShape,
false);
// create and set text graphics algorithm
Text text = gaService.createText(shape, addedClass.getName());
text.setForeground(manageColor(E_CLASS_TEXT_FOREGROUND));
text.setHorizontalAlignment(Orientation.ALIGNMENT_CENTER
);
// vertical alignment has as default value "center"
text.setFont(gaService.manageDefaultFont(getDiagram(),
false, true));
gaService.setLocationAndSize(text, 0, 0, width, 20);
// create link and wire it
link(shape, addedClass);
}
return containerShape;
}
}
Additionally the feature provider has to deliver our newly created feature (overwrite the method getAddeFeature).
This implementation can be seen here:
@Override
public
IAddFeature getAddFeature(IAddContext context) {
// is object for add request a EClass?
if (context.getNewObject()
instanceof EClass) {
return new TutorialAddEClassFeature(this);
}
return
super.getAddFeature(context);
}
Note on graphics algorithms and values: Graphics algorithms, which are created with "create"-methods, have suitable default values as comfort. Default values are defined in the meta model and the framework. The rounded rectangle has the following default values: {lineWidth: 1, lineStyle: SOLID, filled: <unset>, lineVisible: <unset>, transparency: 0.0, width: 0, height: 0, x: 0, y: 0}. When using the "create plain"-methods instead, all values have to be set explicitly. You can find more details about setting values and styles in chapter "Using Styles", "Default Attribute Values of Graphics Algorithms" and in the JavaDoc of IGaCreateService.
Note on colors and fonts: In contrast to other graphical objects like e.g. rectangles or lines, colors and fonts are managed objects. This means that the Graphiti framework keeps track of these objects and enables reuse within one diagram: one specific color (the combination of its RGB values) or a specific font (the name along with its size and the flags for italic and bold) is stored only once within the diagram and is referenced by all objects using this specific color or font. This is why they are not simply created as the other objects but retrieved via the IGaService.manage* methods.
The default font handled by the convenience methods manageDefaultFont is simply the standard font Graphiti uses if nothing else is defined; it is defined as Arial in size 8 in straight representation (no italics, no bold). There might be special font instances of the default font for italic and/or bold representation.
Colors and fonts are basically immutable objects; once they are created there attributes should not be changed again. Instead a new color or font should be requested by calling the manage* methods and set for the relevant objects. Fonts and colors that are no longer needed can of course be deleted but this is not handled by the Graphiti framework and is a task that needs to be implemented by the tool builder if desired.
Note on text fields and the fonts they use: Text fields can be created as above; in this case they do not automatically receive a font, but the tool builder is able to define and set any desired font. On the other hand text fields may also be created using the default font; to do this simply use the createDefaultText methods instead of createText (analogue creation methods for MultiText objects exist). Changing the font lateron will result in having an additional unused font inside your diagram unless the tool builder cares about deleting no longer used fonts.
Note: if the project wizard for a "New Graphiti Sample Project" does not work correctly and you can not test the add feature as described below, please continue with the next chapter and provide create functionality. That will allow to test the add feature directly in the diagram.
Now we can start the editor again. It should be possible to drop an EClass from the tree of the "Graphiti Sample" project into the diagram "Add Feature".
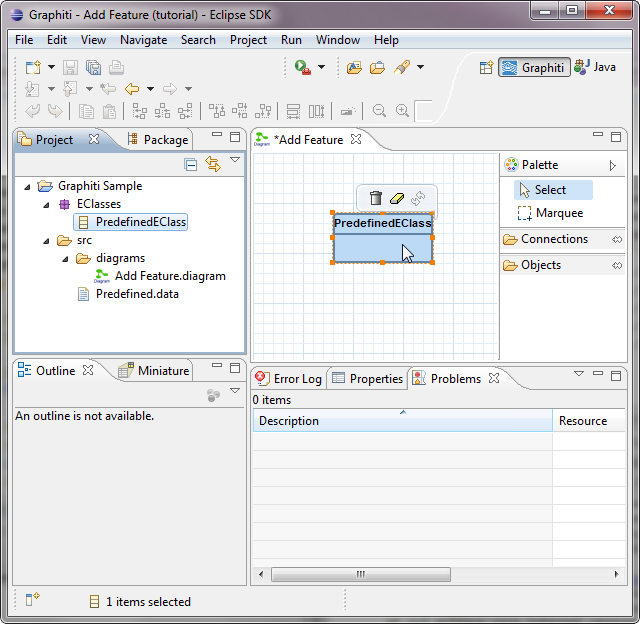
Figure: Add PredefinedEClass to the editor
Without any further implementations it should be possible to move the EClass shapes around, resize them, remove them (context menu) and even delete them.