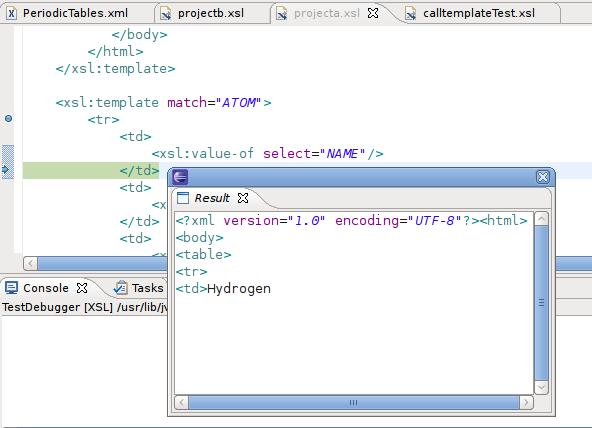
XSLT debugging is handled by the eclipse platforms debugging framework support as outlined in the "Program Debug and Launch Support" . Common operations like stepping into (F5), stepping over (F6), pausing, running to a breakpoint, and relaunching are supported. In addition to the standard Variable and Breakpoint views provided by the platform, there are some XSLT specific views and functionality as well. All of these are common regardless of the particular XSLT debugger being used.
Introduction to Eclipse Debugging
Basic Debugging in Eclipse contains a good general introduction to the basic features provided by the Eclipse Debug view. XSL Tools leverages many of these features and the same concepts apply to the XSL Tools debugger.
In addition to the standard features and functionality, the XSL Tools debugging support adds the following additional items:
Result View
XSLT specific Variables
XSLT Processor Specific Functionality
The XSLT Debugger has a result view. This will show the output that the stylesheet has generated to the current break point or since the last step command was issued.

The result view is updated throughout the debugging process, and is useful to help see what output is generated at specific points during a transformation.