XSL Tools provides a framework for XSLT processors to provide debugging support. The support provided is highly dependent on the processors. XSL Tools comes with built in support for the Xalan 2.7.1 processor. Debugging is only available for those processors that support the feature and plug into the extension point. The XSL Tools debugger leverages the existing eclipse platform Debug View
How the debugger acts will depend on the processor being used. Not all XSLT processors pass the same type of information to the debugger. These differences will be noted in the the section called “XSLT Processor Specific Support” section.
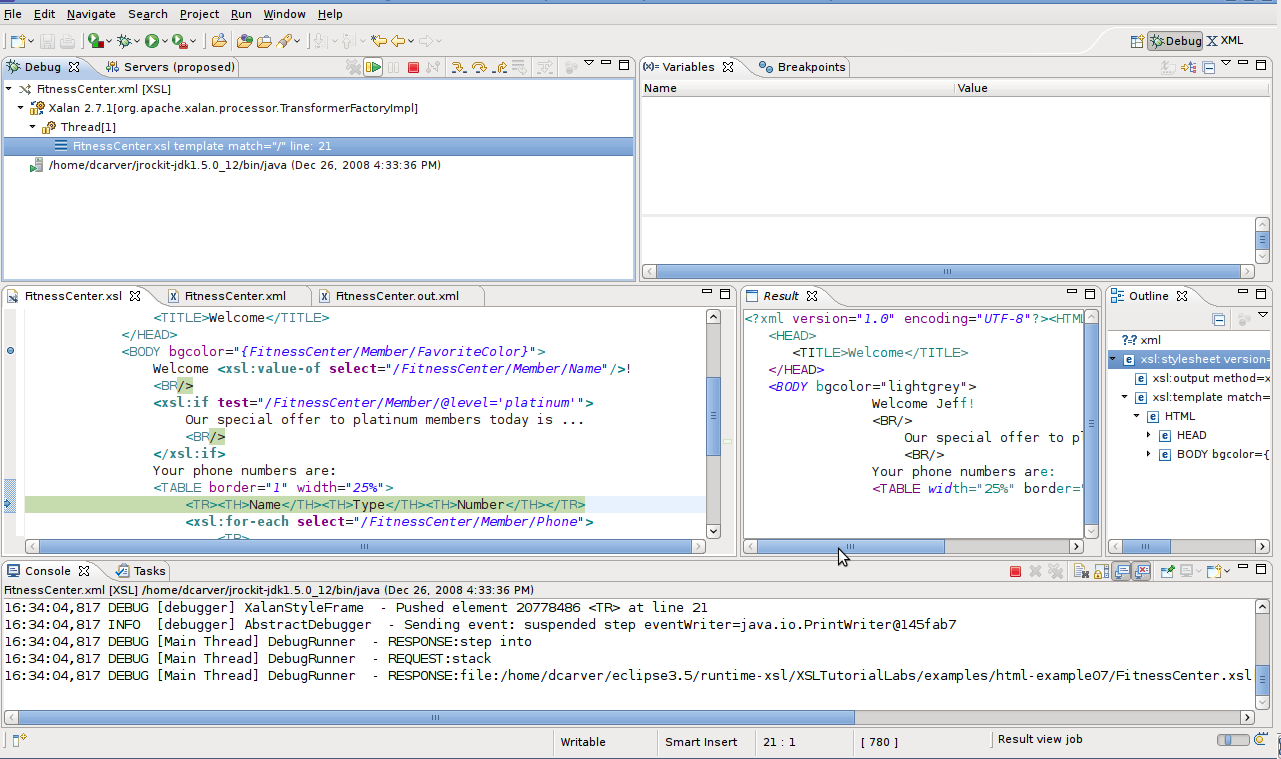
Debugging is started the same way as launching an XSL Tranformation is done. Except that the debug configuration is used instead of the normal launch configuration. If a debugging session is started on a processor that does not support debugging, a dialog will ask if you want to switch to one of the supported debuggers.
Default JRE
The default JRE does not have built in support for debugging, even though it is based on Apache Xalan. It is recommended to use Xalan or another processor provided by an adopter to do your transformations. The default processor is known to have some issues that Xalan and other processors do not have.