Once you have created your Web service and Web service client, you can monitor the Web service's SOAP traffic using the TCP/IP Monitor.
Prerequisites:
- Generate a Web service
- Generate a Proxy and a sample application
When creating a Web service using the Web service or Web service client wizards, you can select to set up and run the TCP/IP Monitor automatically. Alternately, you can set up the TCP/IP Monitor manually by completing the following steps:
- In the sample application, invoke the getEndPoint method. Record this endpoint. The default endpoint for a Web service is: http://localhost:<port>/<web module context root>/services/<port>
- Create a server to act as the TCP/IP Monitor:
- From the Window menu, select Preferences.
- In the Preferences window, expand Run/Debug, and then select TCP/IP Monitor.
- Select the Show TCP/IP Monitor View when there is activity check box.
- Under the TCP/IP Monitors lists, click Add. A New Monitor dialog opens.
- Specify the following settings:
Option Description Local monitoring port Specify a unique port number on your local machine. Host name Specify the host name or IP address of the machine where the server is running. Port Specify the port number of the remote server. Type Specify whether the request type from the Web browser are sent by HTTP or TCP/IP. If the HTTP option is selected the requests from the Web browser are modified so that the HTTP header points to the remote machine and separated if multiple HTTP requests are received in the same connection. If the TCP/IP option is selected, all the requests are sent byte for byte. Timeout Specify how long you would like the monitor to wait before attempting to connect again. - In order to route the Web service through the monitor, the endpoint of the Web service client must be changed. The TCP/IP Monitor listens on port 9081. In the Web browser window used in step 1, invoke the setEndPoint method, and change the endpoint so that it directs to port 9081. For example, the default would be: http://localhost:9081/web_module_context_root/servlet/rpcrouter Invoke the getEndPoint method again to ensure that your change has been implemented.
- Select a Web service method in the Methods pane. Invoke this method.
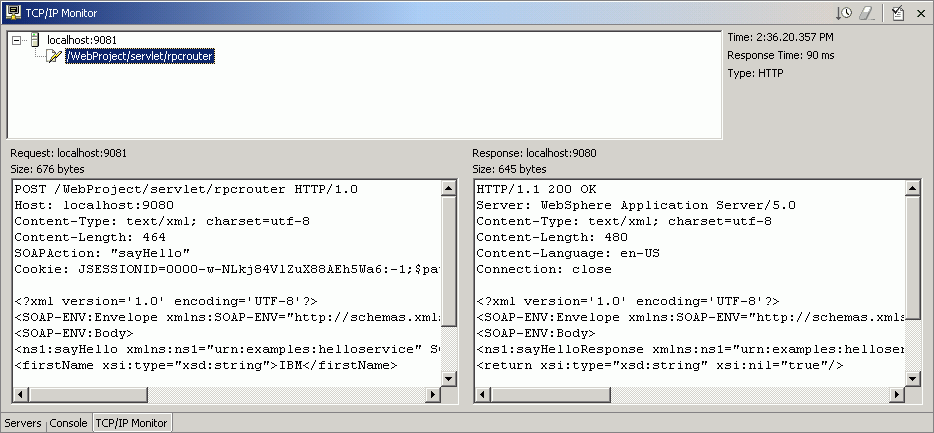
- Change to the TCP/IP Monitor view by selecting the TCP/IP Monitor
tab in the Servers view. This will display request and response pairs that
are being routed through the TCP/IP Monitor. It will look similar to the following
picture:

- To ensure that your Web service SOAP traffic is WS-I compliant,
you can generate a log file by clicking the
 icon. In the dialog box that opens,
select a name for the log file and specify where you want it to be stored.
This log file will be validated for WS-I compliance. You can open
the log file in an XML editor to examine its contents.