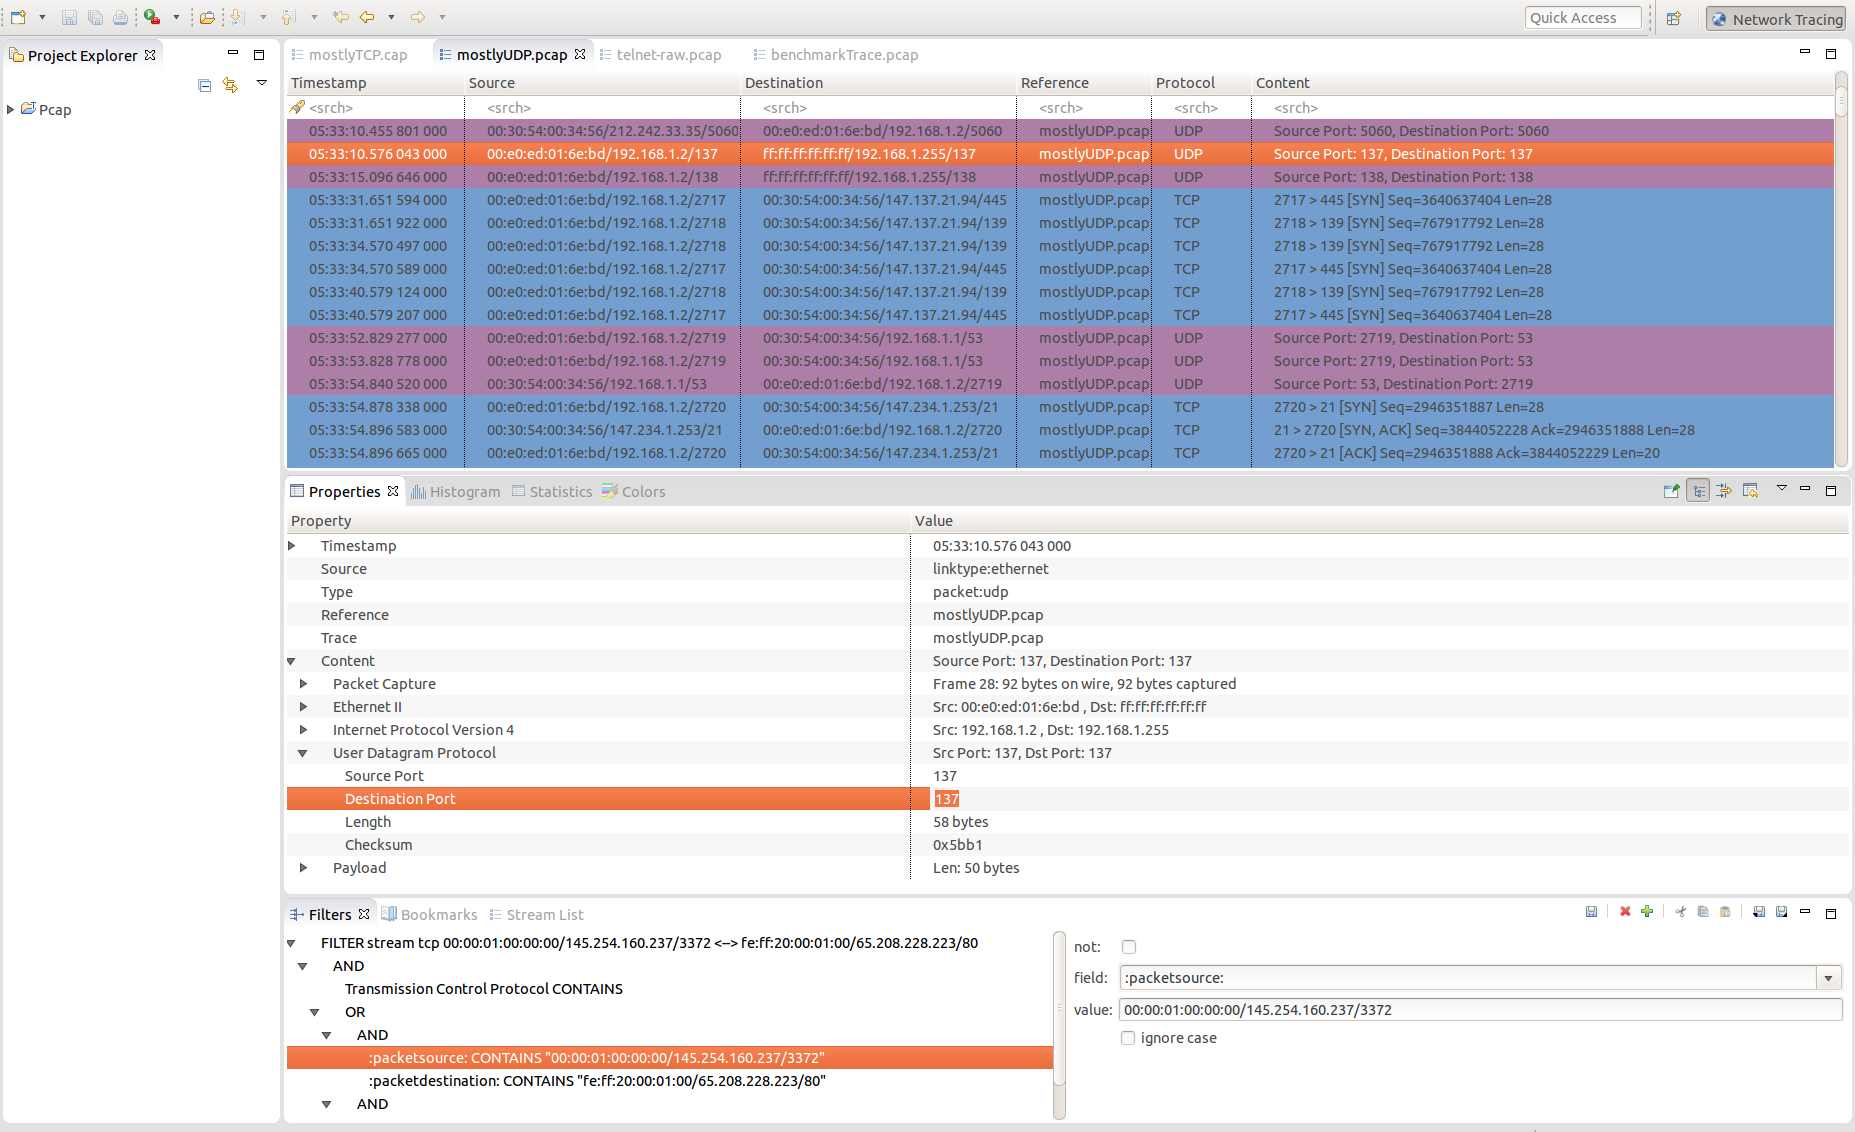
Trace Compass now supports the reading of libpcap files for network tracing. Those files contains packets that were seen on a network, have a .pcap or .cap extension and can be captured with tools like Wireshark/Tshark/Tcpdump. To open a libpcap trace, simply import it just like any other trace type and Trace Compass will recognize the format. Open the imported trace to see the packets that were captured. For more information about generic features of Trace Compass see the User Guides.
Currently, the Pcap integration in Trace Compass can only recognize four protocols: Ethernet, Internet Protocol Version 4, TCP and UDP. In the future, more protocols will be added and supported. If you want to contribute, please see the “Adding a protocol” section in the TMF Developer Guide.
To help analyze the network traces, a new perspective has been created: the Network Tracing perspective. It looks a lot like Wireshark (since it is the de-facto standard) and contains all the views that are useful for network trace analysis. Those views are:
To open the perspective, select Window > Open Perspective > Other... > Network Tracing.

It is now possible to filter on subfields, which is really useful for pcap traces. To do so, in the field combo of the Filter View, start with a slash and type the subfield path by separating the different level with a slash. For instance, to get the Source IP Address of the Internet Protocol Version 4, type:
/Internet Protocol Version 4/Source IP Address
If a field name contains a real slash, type “\/” (backslash-slash) instead to make an uninterpreted slash. For instance, to get the field named “Process/Thread”, type:
/Process\/Thread

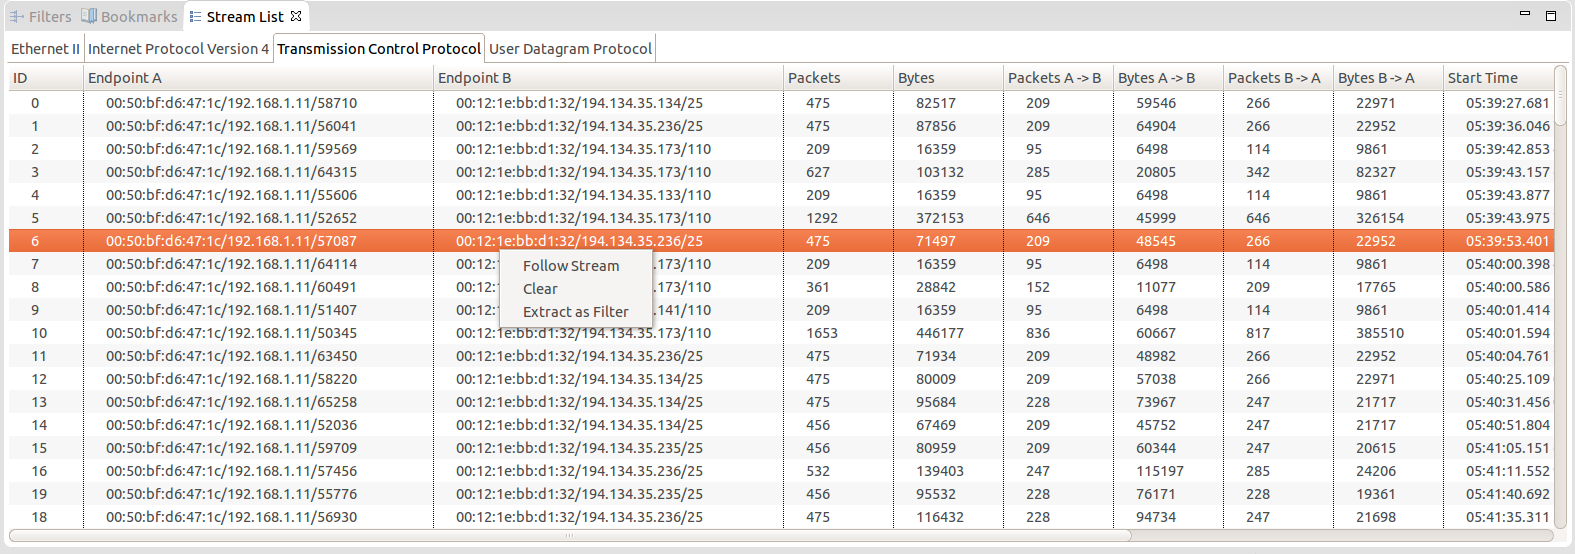
Most of the time, you want to analyze the conversation between two endpoints (a stream). The stream list view allows you to do just that, by isolating the interesting packets. The Stream List View is updated when a new pcap trace is opened and lists all the different streams present in the trace/experiment, for all the supported protocols. By right-clicking on a stream, you can follow a stream, which will send a TmfNewPacketStreamSignal that can be used by other views to run an analysis on the stream. You can also extract the stream as a filter, which will generate a filter based on the stream attributes. It is then possible to customize that filter and apply it on the event editor to get the interesting packets.
