Code Coverage Summary View [PHP Profile Perspective]
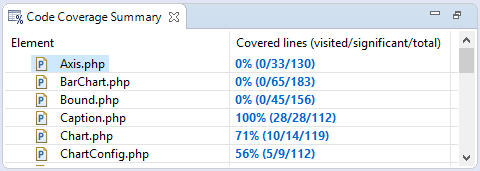
The Code Coverage Summary view presents how many lines of code were covered during the profiling process. The table with coverage information consists of the following columns:
- Element - The file / project that was called.
- Covered Lines (Visited / Significant / Total) - Percentage of lines covered within each file. (Visited = Number of lines covered / Significant = number of lines that were significant to the function call / Total = Total number of lines in the file.)

Clicking on the 'Covered lines' percentages will open Code Coverage View containing the related file, with the covered lines highlighted:

