

| Special Cases | ||
|---|---|---|
|
|
|
|
| Remote Valgrind | Updating This Document | |
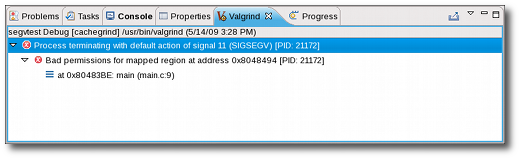
If the profiled application contains any errors or if any Valgrind options you selected result in an error, these errors will be reported in the
Core Messages pane of the Valgrind View. The Memcheck tool outputs all of its profile results on this pane.
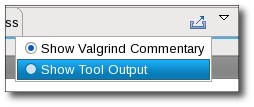
For other tools, it is possible to switch between the Core Messages pane and the tool's output in the Valgrind view menu.
To profile child processes during a profile run, enable the Trace children on exec option in the General Options tab (of the Valgrind Options tab). Memcheck's results will list the process ID (PID) for each reported error in the Valgrind view.
Massif, on the other hand, will present each process separately and allow you to switch between processes with the Select Process ID dropdown icon (
 ) in the Valgrind view toolbar.
Cachegrind will report each PID separately as a top-level element in its output tree.
|
|

|
|
| Remote Valgrind | Updating This Document |