

| General Usage | ||
|---|---|---|
|
|
|
|
| Callgraph Perspectives | Updating This Document | |
Most of Eclipse Callgraph's general functions are available through the Callgraph view's toolbar and View Menu.
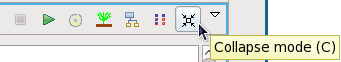
The Callgraph view's toolbar also features a Collapse Mode button. This button groups all identical functions (i.e. those with identical names and call histories) together into one node. Doing so can be helpful in reducing screen clutter for programs where many functions get called multiple times.
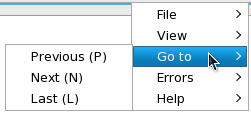
To play a visual representation of a function trace, click the View Menu button then navigate to Goto. This menu will allow you to pause, step through, or mark each function as it executes.
The graph views are linked to the source code as well. To navigate to where a function is called in the code, hold Ctrl while double-clicking on a function's node (in any view except Aggregate View). Doing so will open the corresponding source file in the Eclipse editor and highlight the function call.
To navigate to a function's definition in the source, hold Ctrl while double-clicking on a function's node in the Aggregate View. Doing so will open the corresponding source file in the Eclipse editor and highlight the function definition.
Large projects may take longer to render; as such, Eclipse Callgraph allows you to save the data collected from a profile run. Loading the data file and attempting to render it will take a much shorter time than attempting to go through the full process of profiling a project.
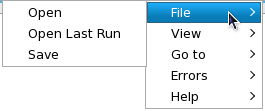
To save or load data from a profile run, navigate to File (under the View Menu); this will display different options relating to saving and loading profile runs.
|
|

|
|
| Callgraph Perspectives | Updating This Document |