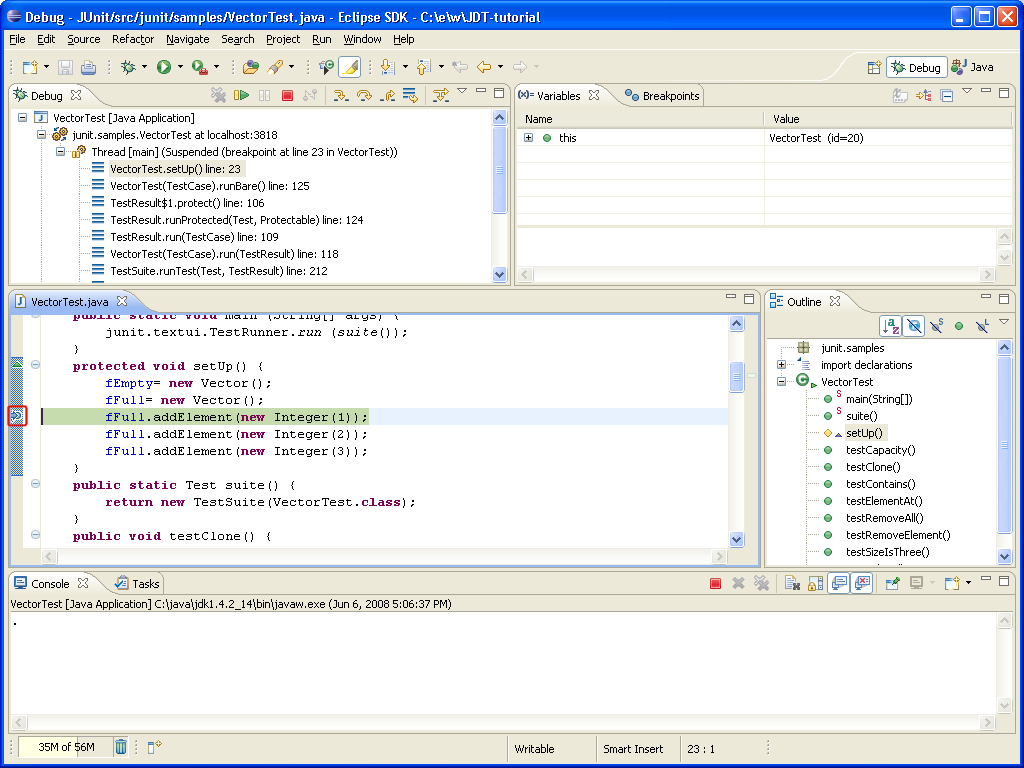
fFull.addElement (new Integer(1));
and double-click on the ruler to set a breakpoint.
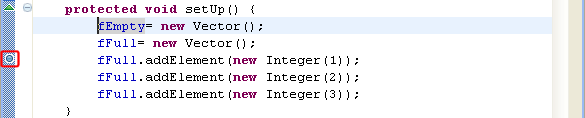
Note: Once the class is loaded by the Java VM, the breakpoint will be installed and a checkmark overlay will be displayed on the breakpoint icon.
main
method. 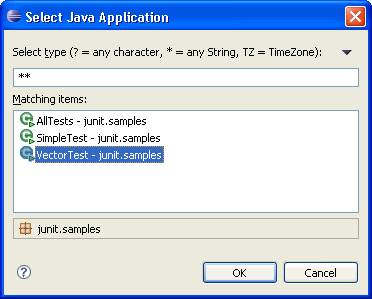
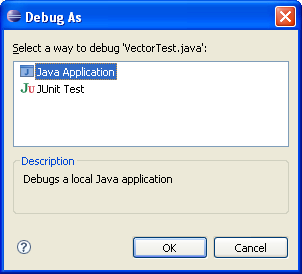
Note: You can also simply hit the debug button 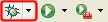 which will launch the currently selected resource or active editor. Select
Java Application when you are prompted to select a way
to debug VectorTest.
which will launch the currently selected resource or active editor. Select
Java Application when you are prompted to select a way
to debug VectorTest.
 since the class
VectorTest was loaded in the Java VM.
since the class
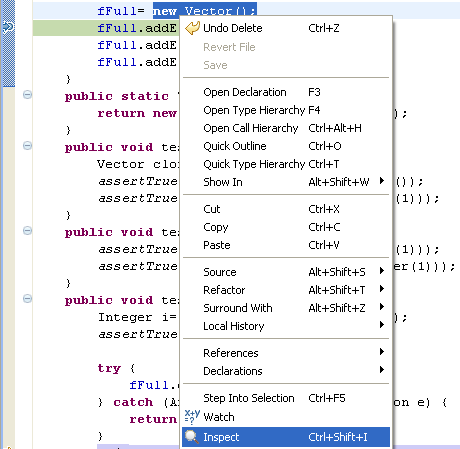
VectorTest was loaded in the Java VM. new Vector() from the line above
where the breakpoint is set, and from its context menu, select Inspect.
 ) button.
Execution will continue at the next line in the same method
(or, if you are at the end of a method, it will continue in the method from
which the current method was called).
) button.
Execution will continue at the next line in the same method
(or, if you are at the end of a method, it will continue in the method from
which the current method was called).
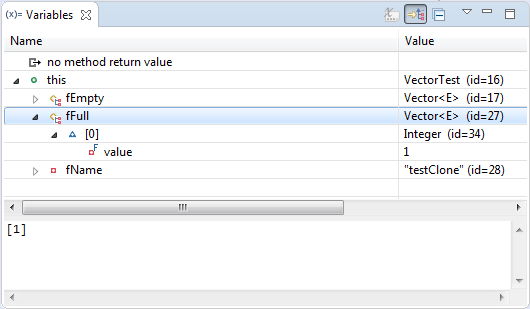
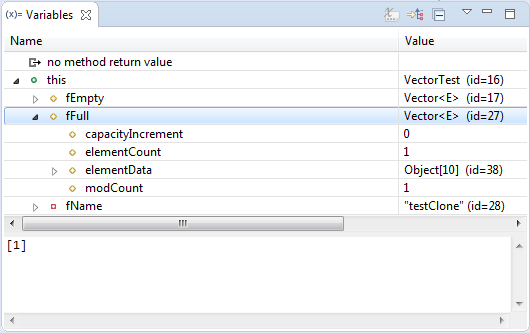
You can choose to disable Show Logical Structure to show the implementation details of these types.
 ,
Step Return
,
Step Return  ) to
step through the code. Note the differences in stepping techniques.
) to
step through the code. Note the differences in stepping techniques.
- You can continue to step over the code with the Step buttons until the program completes.
- You can click the Resume
(
 ) button to allow the
program to run until the next breakpoint is encountered or until the
program is completed.
) button to allow the
program to run until the next breakpoint is encountered or until the
program is completed. - You can select Terminate from the context menu of the program's process in the Debug view to terminate the program.