Graphiti supports the fast and easy creation of homogeneous graphical editors and viewers that visualize an underlying Domain Model using a tool-defined graphical notation and make editable. We locate Graphiti in the Eclipse Modeling arena and distinguish the framework from GMF and GEF. Then, we give an overview of the architecture and an introduction into the basic concepts of Graphiti.
Typical examples are class diagram editors (using the UML notation) or process flow editors (using the BPMN notation) as you can see in figures below..
Starting with release 0.10.0 Graphiti can also be used for displaying diagrams in Eclipse views or on popups.
Figure: Example screenshot of a class diagram editor
Figure: Example screenshot of a process flow editor
If one tries to build a graphical editor for a Domain Model using Eclipse, he will soon come across the Eclipse Modeling Framework (EMF) and the Graphical Editing Framework (GEF). While EMF provides the basis for modeling, GEF supports programming graphical editors.
But it is immediately noticeable, that GEF is fairly complex and it needs a notable amount of work to get used to the framework. Therefore, and also to homogenize their tooling, SAP built a framework that hides GEF's complexities from the developer and bridges EMF and GEF to ease and speed up the development of graphical editors. The easy-to-understand programming model of Graphiti is based on features.
After SAP AG decided in 2009 to donate the framework to the eclipse community, the development team was able to deliver the 0.7.0 incubation release of the Graphical Tooling Infrastructure (Graphiti) in October, 2010 and 0.8.0 with Indigo in June 2011. We should emphasize that already the SAP-internal predecessor of Graphiti was in productive use.
Graphiti provides the following benefits for development and usage:
Graphiti is an alternative to the Graphical Modeling Framework (GMF) that exists for some time at Eclipse. Basic differences in the paradigms of Graphiti and GMF are listed in table below.
| Graphiti | GMF | |
| Architecture | runtime-oriented | generative |
| Interface | self-contained | GEF-dependent |
| Client-Logic | centralized (feature concept) | distributed functionality |
| Look & Feel | standardized, defined by SAP usability experts | simple, adaptable in generated code |
Table: Graphiti vs. GMF
As paramount difference between the architectures of the frameworks we rate that GMF follows a generative approach, while in Graphiti one programs against a plain old Java interface. Graphiti's approach has the big advantage, that no generated source code must be manipulated to adapt the editor – in contrast to GMF where one has to change generated sources, which can cause headaches when regenerating.
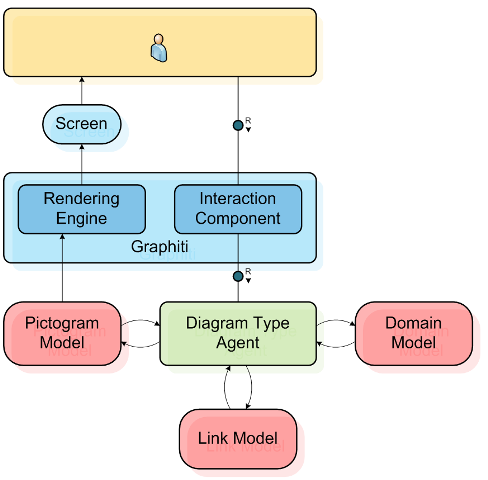
Figure: Basic architecture
Naturally, communication between a user and a Graphiti based tool happens via the screen as well as by mouse and keyboard (see figure). An Interaction Component will receive requests such as resizing, drag-and-drop, or deleting. The actual processing of these requests happens in a so-called Diagram Type Agent, which will be discussed in the following section in more detail.
It is the objective of the Rendering Engine to display the current data on the screen. Rendering Engine and Interaction Component together form the framework components of Graphiti - and thus the actual Graphiti runtime. The technical realization of the Graphiti runtime is based on the Graphical Editing Framework (GEF) in conjunction with Draw2d. Graphiti’s defaults ensure a uniform user interface (look and feel) of all Graphiti based tools.
As mentioned already above, the Diagram Type Agent is addressed via the Interaction Component. This happens over a standardized interface. The Diagram Type Agent has to be implemented and made available by the developer. For this implementation developers can make use of lots of various services as well as many meaningful standard implementations.
Assistance of the services and standard implementations can support a developer to create his own graphical editor really fast. For example, actions like move, resize, delete, remove, and print are available immediately. One should not regard a first version as a prototype which has to be thrown away later. Rather the initial version can be extended to a complete product incrementally with increasing Graphiti know-how and rising requirements.
In other words: In the beginning a developer comes to a functional editor very quickly. This editor can be adorned gradually (e.g. color gradients) and can be equipped with additional functionality (e.g. direct editing, extension of the context menus and context buttons).
A Diagram Type Agent’s major task is to modify the model data. On the one side we have the Pictogram Model (incl. Link Model) whose metamodel is made available by Graphiti and on the other side we have the domain specific model which comes from the developer. These models are explained in the following.
The Domain Model contains the data which has to be visualized graphically. A developer would for example use the Ecore metamodel for a graphical Ecore editor. An editor for BPM (Business Process Management) would use the Businesses Process Modeling Notation.
It is of advantage (however not absolutely necessary) if this model is available in EMF just like the Pictogram Model. But Graphiti can deal also with models outside EMF. In Graphiti, the data of the Domain Models are called Business Objects.
The Pictogram Model contains the complete information for representing a diagram. That implies that each diagram can be represented without the presence of the Domain Data. This requires a partially redundant storage of data, which is present both in the Pictogram Model and in the Domain Model. Imagine the class names in case of an Ecore editor. Since data redundancy always draws the problem of the synchronization, Graphiti offers a concept to update this data. Data which is out of sync can be visualized graphically and can be corrected (semi-) automatically by the use of so-called Update Features. This approach enables an editing of Domain Data with different tools and a subsequent updating of already existing diagrams.
A detailed discussion of the Pictogram metamodel would blow up the content of this chapter. Further information can be found in the „org.eclipse.graphiti.mm “-plugin which contains the metamodel and some diagrams. The diagrams can be viewed with the help of the Ecore tooling.
Where data of the Pictogram Model is produced for the graphical representation is shown here.
The Link Model is responsible for connecting data from the Domain Model and the graphical representation (that is, data from the Pictogram Model). These connections are again needed by many actions in the graphical editor. For instance, a deletion or a move of a graphical object needs also access to the associated object of the Domain Model in order to be able to make the necessary changes.
The tasks of the Diagram Type Agent can be explained most conveniently on the basis of a small example - in this case we use a create operation which is initiated by the user through the Interaction Component. The user clicks into the tools palette of the graphical editor and draws a rectangle in the diagram to indicate size and position of the object to be created. Now the Diagram Type Agent does the following:
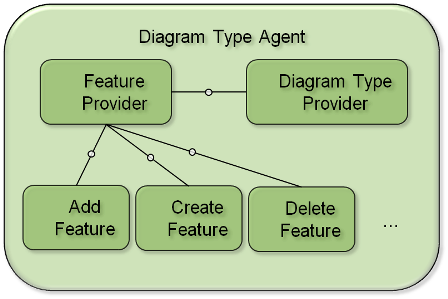
Figure: Construction of the diagram type agent
The figure above displays the internal structure of the Diagram Type Agent. The actors shown there are to be provided by the developer. This means he has to implement an amount of so-called Features which are similar to operations. Here are some typical examples for Graphiti Features:
A Feature Provider supplies the needed features considering the given context. Processing the features leads to the modification of the appropriate data specified above.
Further diagram type specific and tool specific requests to the Interaction Component are handled by the Diagram Type Provider. This includes the selection of the appropriate update strategy, that is, the decision when synchronizations between Domain and Pictogram Model have to be done.
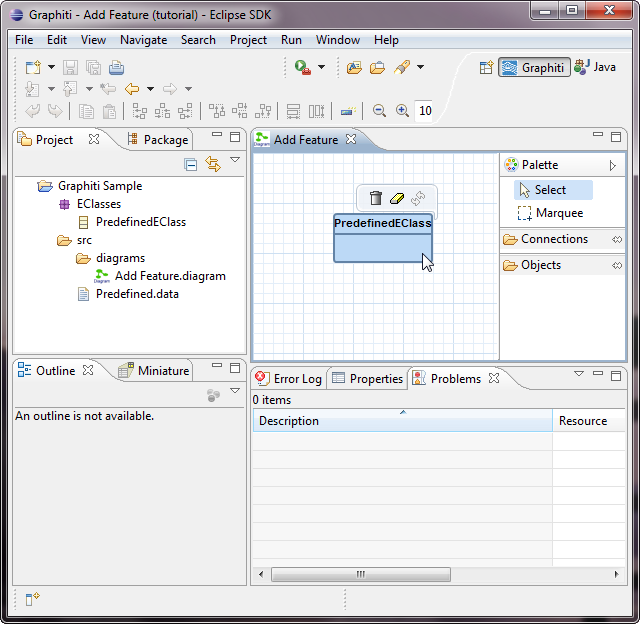
Figure: Simple EClass Editor
You see in the figure above a first version of a ready-to-run graphical editor for Ecore metamodels, which you will achieve after implementing a Diagram Type Agent in four simple steps at the beginning of the Graphiti Tutorial. The amount of code necessary for this is very low, which is due to the rich standard implementations that are already part of the framework.
Drag-and-drop gets the PredefinedEClass on the diagram, as it is shown in the figure. Without any further implementations the EClass Shape can be moved, resized, printed, and even deleted.
The graphical reperesentation of an EClass is shown as a rounded rectangle that contains a separator-like horizontal line above which the name of the EClass appears as text.
The Diagram Type Agent is implemented in following steps: first a Diagram Type Provider is implemented , and then it is registered it for a new Diagram Type. In the third step, a Feature Provider is created for which an Add Feature is implemented in the end.
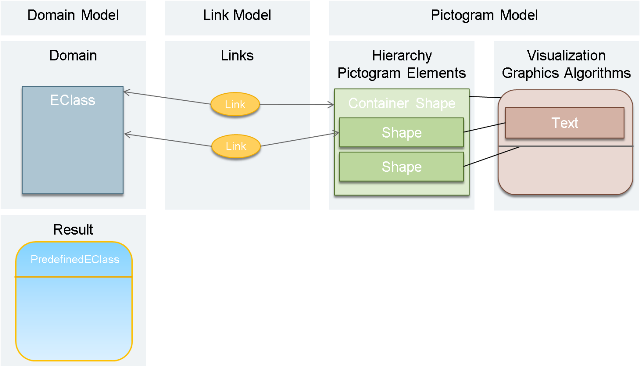
Figure: Linkage of the involved artifacts
The Figure above illustrates how the EClass will look like in the editor (Result). The upper part of the figure shows how the Pictogram Elements of the Add Feature, which are necessary for the graphical representation, are wired with the Domain Object.
In the left column of the Pictogram Model a Container Shape aggregates two child Shapes, which are responsible for the Text Label and the separation line. All three Shapes aggregate specific Graphics Algorithms providing the complete information to allow the rendering of the EClass in the editor. Examples for such information are positions, fore- and background colours or a gradient, visibility, and line width as well as a line style. In our example we have a Rounded Rectangle providing an additional corner radius, a Polyline having defined end- and bend points, and a Text Label containing a text value.
The Container Shape and likewise the Shape containing the Text Label are related to a corresponding EClass from the Domain Model. The relationship is realized through special Link Objects which contain both ends.