Debugging a local target
Debugging a CBS project is done via the Launch Bar. Make sure the launch bar is installed and enabled.
First build the project for Debug. See Building a project.
-
Select the launch configuration of the project you want to run.
-
Select launch mode Debug.
-
Press the Debug button in the launch bar.
-
Confirm the switch to the Debug Perspective.
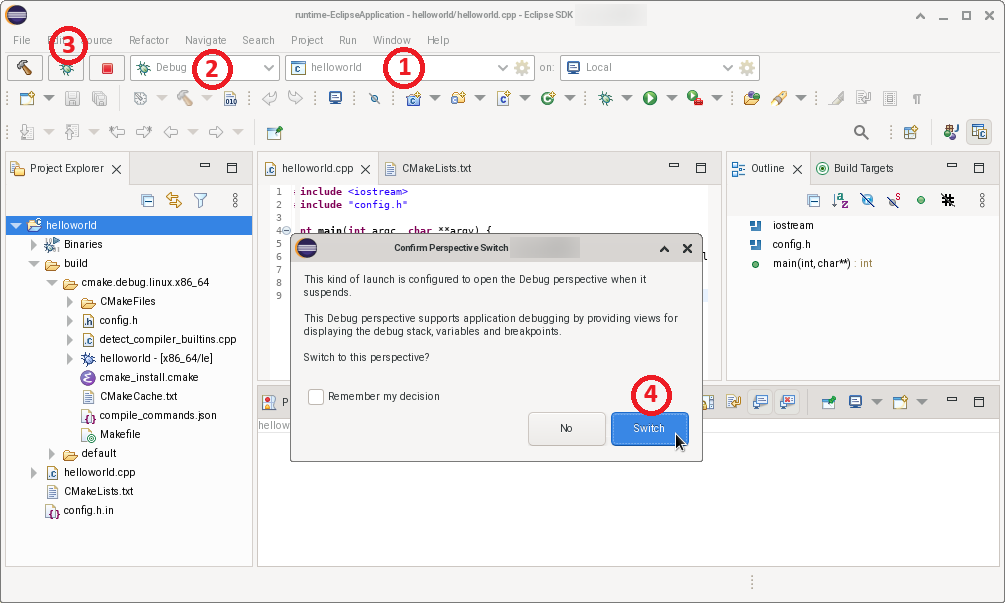
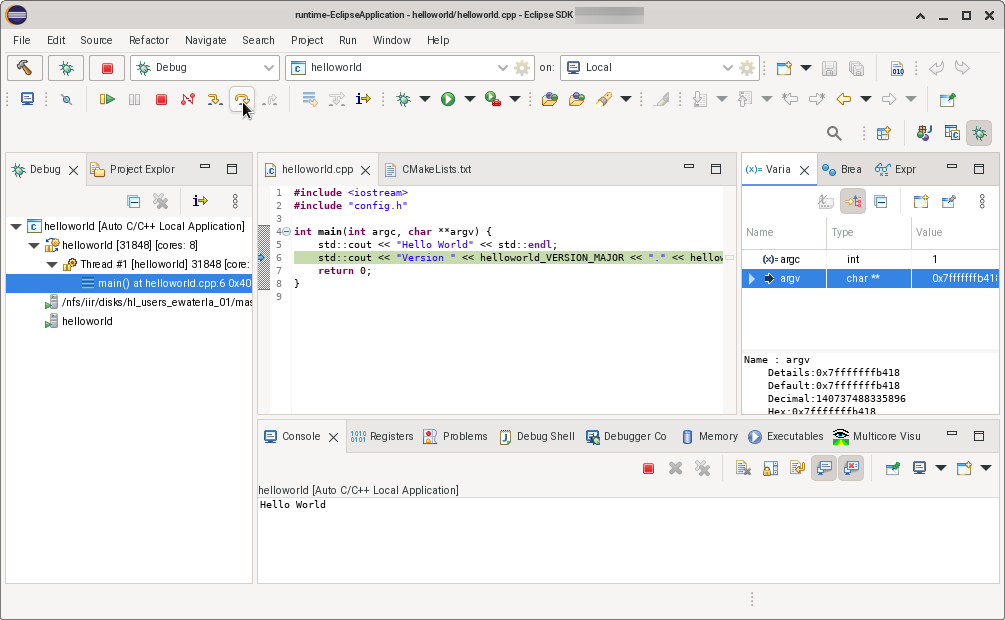
The Perspective will change to Debug, and you can start debugging.
Changing debug settings
To change debug settings:
-
Set the launch mode to Debug
-
Edit the project’s launch configuration. Click on the gear icon.
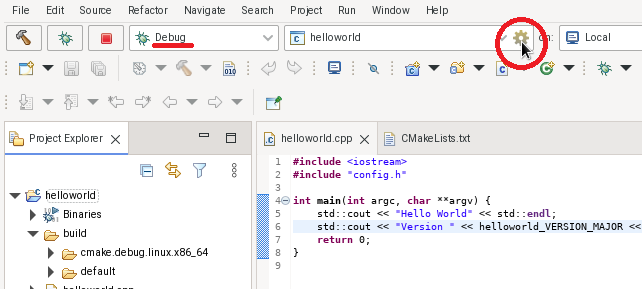
The edit launch configuration wizard will open. Notice that there are now two extra tabs Debugger and Source, because the launch mode is Debug. These are not present in launch mode Run.
On the Main tab you can set an alternative C/C++ application, and you can enable or disable build before launch.
On the Arguments tab you specify optional arguments, and you can change the working directory.
On the Environment tab you define optional environment variables.
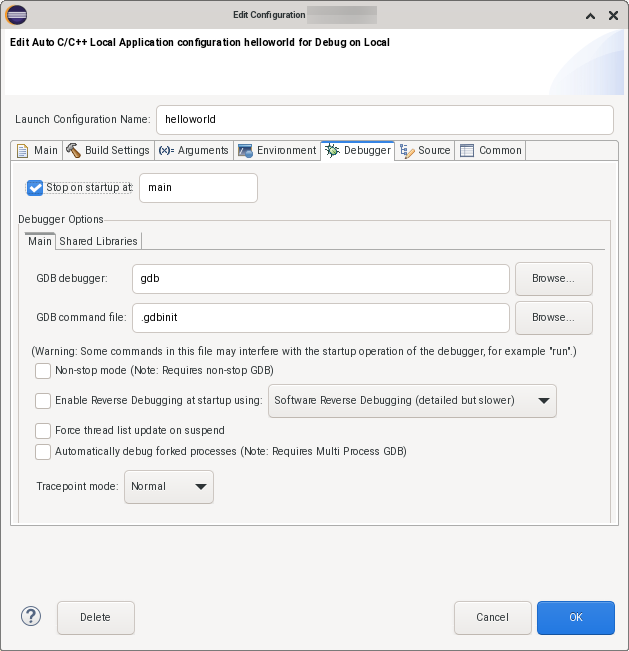
On the Debugger tab you can set an alternative debugger. If the debugger name is not an absolute path, CDT will look first for the debugger in the selected toolchain in the Build Settings tab. When it is not found in the toolchain the debugger is searched in the PATH environment variable defined locations.
On the Source tab extra paths outside the project folder can be defined to look for source code.