Memory view
The  Memory view of the Debug
perspective lets you monitor and modify your process memory. The process memory
is presented as a list of so called memory monitors. Each monitor represents
a section of memory specified by it's location called base address. Each
memory monitor can be displayed in different predefined data formats -- memory
renderings. The debugger supports five rendering types -- hexadecimal
(default), ascii, signed integer and unsigned integer. The
default rendering is displayed automatically on the monitor creation.

The Memory view contains two panes -- the Memory Monitors pane and the Memory Renderings pane. The Memory Monitors pane displays the list of memory monitors added to the debug session currently selected in the Debug view. The content of the Memory Renderings pane is controlled by the selection in the Memory Monitors pane and consists of the tabs that display renderings. The Memory Renderings pane can be configured to display two renderings simultaneously.
Memory view toolbar options
The table below lists the icon3s displayed in the Memory view toolbar.
Icon |
Name |
Description |
|---|---|---|
New Memory View |
Click to create a new memory view. | |
Pin Memory Monitor |
Select to pin the memory monitor on top of all other memory monitors. | |
Import |
Import a previously exported memory monitor. | |
Export |
Export the selected memory monitor. | |
Toggle Memory Monitors Pane |
Shows/hides the Memory Monitor pane. | |
Toggle Split Pane |
Toggles the Memory Renderings pane split. | |
Link Memory Rendering Panes |
Synchronizes the selection of two memory renderings. | |
Switch Memory Monitor |
When more than one memory monitor is active, select a different memory monitor to view. | |
| View Menu > Layout | Switch the Monitors and Rendering panes display between horizontal or vertical orientation. | |
| View Menu > Preferences | Opens the Preferences window allowing you to set:
| |
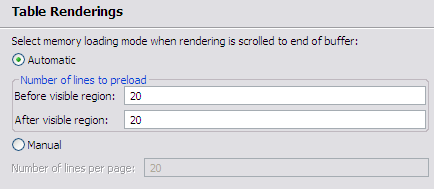
| Table Rendering Preferences | Specify the memory loading mode to use when rendering scrolls to the end of the buffer.  |
|
| Traditional Rendering Preferences | Opens the Traditionally Memory Rendering pane in the Preferences dialog box. | |
| Find/Replace... | Opens the Find/Replace dialog box to search the Memory Rendering view. | |
| Find Next | Finds the next occurrence of the search string. |
Monitors pane context menu
The Monitors pane context menu inside the Memory view includes:
Icon |
Name |
Description |
|---|---|---|
Add Memory Monitor |
Adds a new memory address or variable to the Memory Monitors pane. | |
Remove Memory Monitor |
Removes the selected memory address or variable from the Memory Monitors pane. | |
Reset |
Resets the current memory monitor view. |
Rendering pane context menu
The Rendering pane context menu inside the Memory view includes:
Icon |
Name |
Description |
|---|---|---|
Add Rendering |
Add a memory rendering pane to display a memory monitor item at a different address or in a different format. | |
Remove Rendering |
Removes the selected rendering from the Memory view. | |
| Panes | Enable or disable the showing of the Address, Binary, and Text portions of the rendering view. | |
| Endian | Toggle between the Little (default) and Big Endian display of memory. | |
| Text | Choose the character encoding used to convert memory values into text for display. Choices include: ISO-8859-1 (default), US-ASCII, or UTF-8. | |
| Cell Size | Specify the cell size used to display values in the Binary column. Choices include: 1, 2, 4 (default), and 8 bytes. | |
| Radix | Specify the radix used to display the values in the Binary column. Choices include: Hex, Decimal Signed, Decimal Unsigned (default), Octal, and Binary. | |
| Copy To Clipboard | Copies the selected portion of the Rendering pane to the clipboard. | |
| Go To Address | Opens an edit box to type in a memory address. Press Enter to go to that address and show it in the Rendering pane. | |
| Reset To Base Address | Resets the Rendering pane to the original base address. | |
Refresh |
Refreshes the Rendering pane. |
