Profiling a PHP Web Page
This procedure describes how to profile whole applications, projects, files or collections of files that are already on the server.
- Click the arrow next to the Profile button
 on the toolbar and select Profile Configurations... -or- from the main menu go to Run | Profile Configurations... -or-right-click in Project Explorer view and select Profile As | Profile Configurations...
 - A Profile launch configuration dialog will appear.
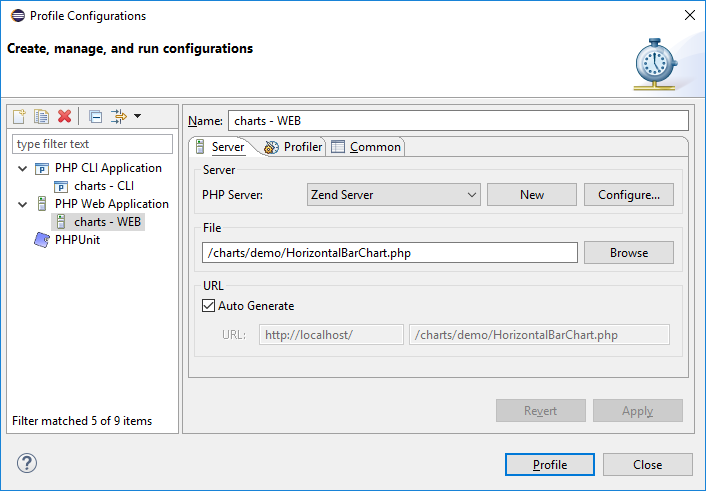
- Double-click the PHP Web Application option to create a new Profile configuration.

- Enter a name for the new configuration.
- Select your server from the PHP Server: list. If you have not configured your server yet, click New, the PHP Server Creation Wizard will open.
- Under PHP File, click Browse and select your 'profile target' file (the file from which the profiling process will start.).
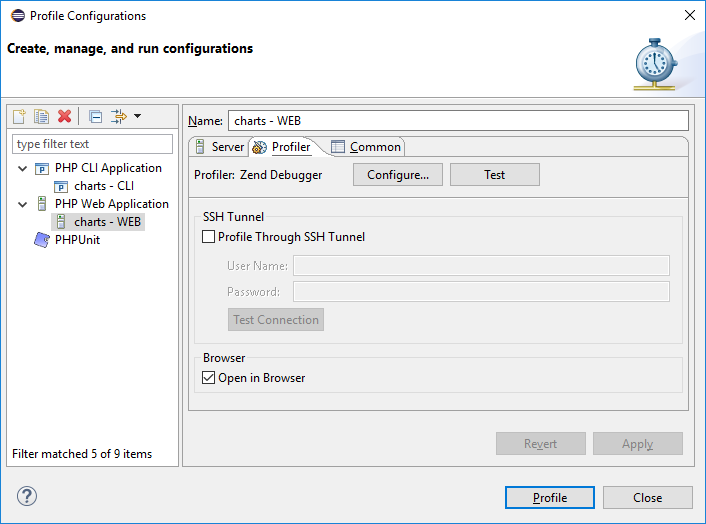
- For further profiling options, select the Profiler tab, which has the following options:
- SSH Tunnel - Use this group option to perform profile session with the use of SSH tunneling
- Open in Browser - Mark if you would like the application to be displayed in browser

- Click Apply and then Profile.
- A confirmation dialog will be displayed asking whether you want to open the profiling perspective.
Click Yes. (If you would like the profiling perspective to open by default in the future, mark the 'Remember my decision' checkbox.)
The PHP Profile Perspective will open, displaying the Profiling Monitor window with various Profiling views.
See PHP Profile perspective for more on the information displayed once a profile session has been run.
