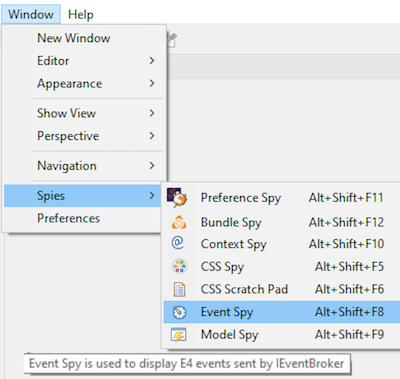
| New Spies in PDE |
The following spies has been added and can be accessed by Windows > Spies :
- Preference Spy
- Bundle Spy
- Context Spy
- CSS Spy
- CSS Scratch Pad
- Event Spy
- Model Spy
|
| Reference an existing target inside another one |
It is now possible to reference an existing target file inside another target:
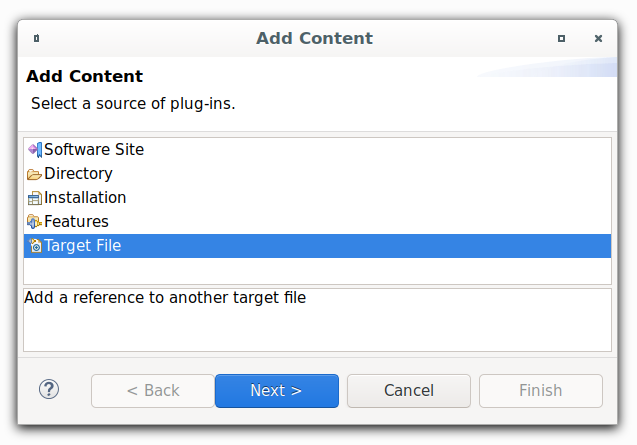
This could be used for different purposes:
- You could use a target from a remote location (e.g. github-repository using http-protocol) in your local IDE.
- You could use a target deployed at a maven repository using the mvn:<groupid>:<artifactid>:<version> (this requires m2eclipse with PDE integration)
- You could extend an existing local target using eclipse-variables
- You could combine any of the above options
|
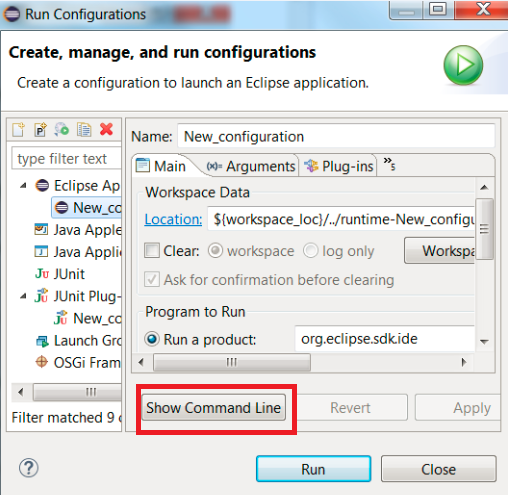
| Show Command Line button in PDE Launch Configuration |
You can view the command line used for launching the application by clicking the Show Command Line button on the PDE launch configuration dialog.
|
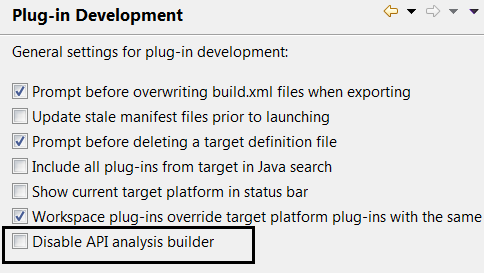
| Disable API analysis builder |
You can disable the API analysis builder on the Plug-in Development preference page.
|
| Layout Spy tool |
To debug SWT layouts, you can activate the Layout Spy tool by using the shortcut Ctrl+Alt+Shift+F9 from any window.
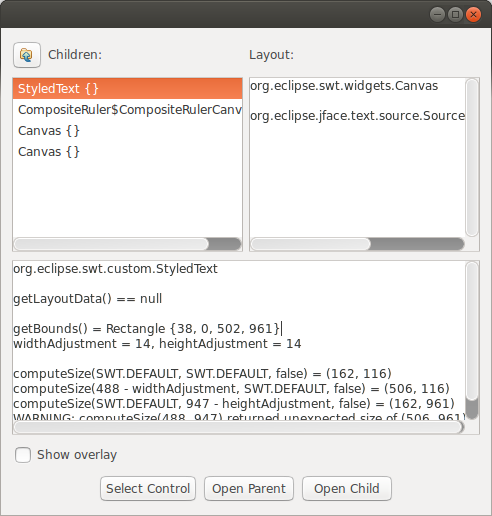
Usage:
- Click Select Control then click the control you want to inspect.
- Enable Show overlay and navigate the widget hierarchy until you find a
control whose boundary is correct (the red rectangle) and whose child's boundary
is incorrect (the yellow rectangle).
- Look at the results of computeSize. If the result of computeSize is correct,
the problem is in the parent layout or its attributes. Otherwise, the problem
is in the child widget.
|
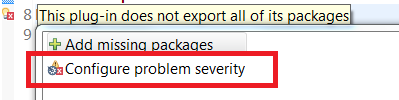
| Change problem severity |
You can configure the severity of an API tools problem or PDE compiler problem by invoking the Quick Fix (Ctrl+1) which opens the
corresponding preference page and highlights the configurable problem.
|
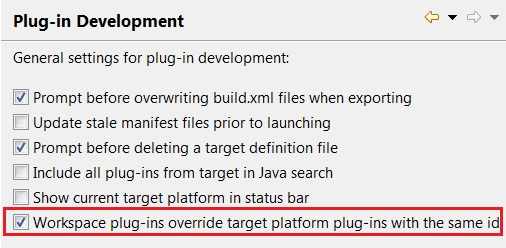
| Workspace plug-ins overriding target plug-ins |
On the Plug-in Development preference page, there is an option to specify if workspace plug-ins should override target platform plug-ins
with the same id. By default, this option is enabled. When disabled, all plug-in versions from workspace and target platform will
be used and for a plug-in id, the best available plug-in will be chosen.
|
| Support for OSGi Declarative Services Annotations |
OSGi Declarative Services provide a powerful mechanism for developing complex, service-oriented
applications. With proper tooling, annotations added to Declarative Services make it easy
to generate and maintain the required component descriptor files.
When enabled, PDE automatically generates and updates Declarative Services component
descriptor files from appropriately annotated Java source. This is done without requiring
any additional builder to be configured in your project.
When you annotate your component implementation classes with @Component, and any
reference bind methods with @Reference, PDE will validate your annotations
and generate the corresponding component descriptor files. Any errors discovered during validation
are highlighted and reported.
In addition, PDE also maintains the project's MANIFEST.MF and build.properties file
-- generated component descriptor files are automatically added to the manifest
and included in the build.
To enable this feature, go to Preferences or Project Properties > Plug-in Development > DS Annotations
and check Generate descriptors from annotated sources.
|
| Convert API Tools Javadoc tags to annotations |
Plug-ins using API Tools can add restrictions to API Java types (such as No Reference, No Extend)
using Javadoc tags or annotations. It is recommended that projects use annotations, so PDE
provides a conversion wizard that will replace the tags with the equivalent PDE annotations.
The wizard is available by right clicking on an API Tools enabled plug-in project and selecting
Plug-in Tools > Convert API Tools Javadoc Tags.
A list of the available restrictions is available on the API Tools
wiki page.
|
| Show the current target platform in status bar |
If you regularly switch between target platforms, PDE provides an option to show the current target
platform in the status bar. On the Plug-in Development preference page, select
Show current target platform in status bar. The status bar entry will show the name of
the active target definition and will show an error icon if there are problems with the target.
|
| Find a feature by entering a plug-in name in the feature selection dialog |
When adding a feature to a product, feature or launch configuration, you can enter the name of a plug-in in the filter text box
of the feature selection dialog. Features that include that plug-in will match the filter and be displayed.
|
| Reload button in target editor |
In scenarios where the target editor is left in inconsistent state due to issues like unstable network connection and
it is impossible to resolve the condition without manually editing the target editor file, you can use the Reload button in the Locations section of Target editor.
It clears the cached p2 profile and then resolves the target.
|
| Set default preference values for your product |
In order to set default preference values for your product, instead of manually adding the preferences to product's customization file, you can use the
Convert Preferences wizard in the Customization section of your Product editor.
|
| Create an API Baseline from a Target Definition |
To avail API tooling functionalities for any target definition, you can create an API Baseline in the Plug-in Development > API Baselines preference page.
|
| Quickly search for any plug-in artifact |
Use the Open Plug-in Artifact dialog to quickly find and open plug-in artifacts. Search
by the name of the plug-in, feature or product, or search for a specific package, extension point
or extension. The icons can be used to see whether the artifact is available in the workspace or
if it comes from the target platform. You can press Ctrl-Shift-A to open the dialog.
|
| To clean or not to clean |
When you create a new runtime
workbench launch configuration, PDE presets the Program Arguments on the
launch configuration to include a -clean argument.
This -clean argument clears all runtime-cached data in your runtime
workbench from one invocation to the next to ensure that all the changes
made in your host workbench, e.g. new Java packages were added to a plug-in
project, etc., are picked up when you launch a runtime workbench.
This clearing of the cache may hinder performance if your target platform
contains a large number of plug-ins.
Therefore, if you're in a situation where your target platform has a
large number of plug-ins and you're at a stage where you are not actively
adding/removing packages from your plug-in projects, you could remove the
-clean argument from the launch configuration to improve startup time. |
| Importing with linking |
Importing external plug-ins and
fragments can be time consuming and may result in large workspaces,
depending on the content of the plug-ins being imported. Therefore,
the 'Import External Plug-ins and Fragments' wizard gives you the option to
import with linking. This means that the import operation will not
copy the resources being imported into your workspace. It will simply
create links to the files being imported. You will be able to browse
these linked resources, as if they had been copied into your workspace.
However, they are physically not there on your file system, so you will not
be able to modify them. Beware of operations that depend on files
being physically in your workspace, as they will not work on linked
resources. |
| Templates |
For a quick start, PDE provides
several template plug-ins that will generate a plug-in with one or more
fully-working extensions. In addition, if at any point, you would like
to add a new extension from the template list (without having to generate a
plug-in), you could access these extension templates directly from the
manifest editor. From the 'Extensions' page of the editor, click
'Add...'. In the wizard that comes up, select Extension Templates in
the left pane and choose the template of choice in the right pane. |
| Plug-in dependency extent |
If you have ever looked at the
list of plug-ins that your plug-in depends on and wondered why your plug-in
needs a particular plug-in X, now you can easily find out why.
The Compute Dependency Extent operation
found on the context menu in several contexts (including manifest file
Dependencies page and Plug-in Dependencies view) performs a combined Java and
plug-in search to find all Java types and extension points provided by
plug-in X which are referenced
by your plug-in. The results will be displayed in the Search view. When a type is selected in the Search results view, the References
in MyPlugIn action in the context menu searches for the places
in the plug-in where the selected type is referenced.
If the
search returns 0 results, you should definitely remove plug-in X from your
list of dependencies, as it is not being used at all, and it would just slow
class loading.
The Compute Dependency Extent is also useful to check if you are
using internal (non-API) classes from plug-in X, which might not be
desirable. |
| Finding unused dependencies |
Minimizing a plug-in's number of
dependencies is certain to improve performance. As your plug-in
evolves, its list of dependencies might become stale, as it might be still
containing references to plug-ins that it no longer needs. A quick way
to check that all dependencies listed by your plug-in are actually used by
the plug-in is to run the 'Find Unused Dependencies' utility, which is
available through the context menu of the 'Dependencies' page of PDE's
manifest editor. |
| Extending the Java
search scope |
Java Search is limited to projects
in your workspace and external jars that these projects reference. If
you would like to add more libraries from external plug-ins into the search:
open the Plug-ins View, select a plug-in and choose Add to Java Workspace Scope
from the context menu. This is handy for remaining
aware of other plug-ins that depend on ones you're working on.
On the Plug-in Development preference page you can also turn on
Include all plug-ins from target in Java workspace scope, which will add every
plug-in in your target platform to the search scope. |
|
Creating a Rich Client Application
|
The
 Creating a Rich Client Application
cheat sheet will guide you through the individual steps to create a plug-in,
define a plug-in based product, customize a product, export a Rich Client Platform (RCP)
application and define a feature-based product using the Plug-in Development Environment (PDE). Creating a Rich Client Application
cheat sheet will guide you through the individual steps to create a plug-in,
define a plug-in based product, customize a product, export a Rich Client Platform (RCP)
application and define a feature-based product using the Plug-in Development Environment (PDE).
|
|
Creating an Eclipse Plug-in
|
The
Creating an Eclipse Plug-in
cheat sheet will guide you through the individual steps to create a plug-in, a plug-in extension,
a feature and an update site using the Plug-in Development Environment (PDE).
It will also demonstrate how to install and uninstall a feature using Install/Update.
|